
September 9, 2026
What is foot traffic data?
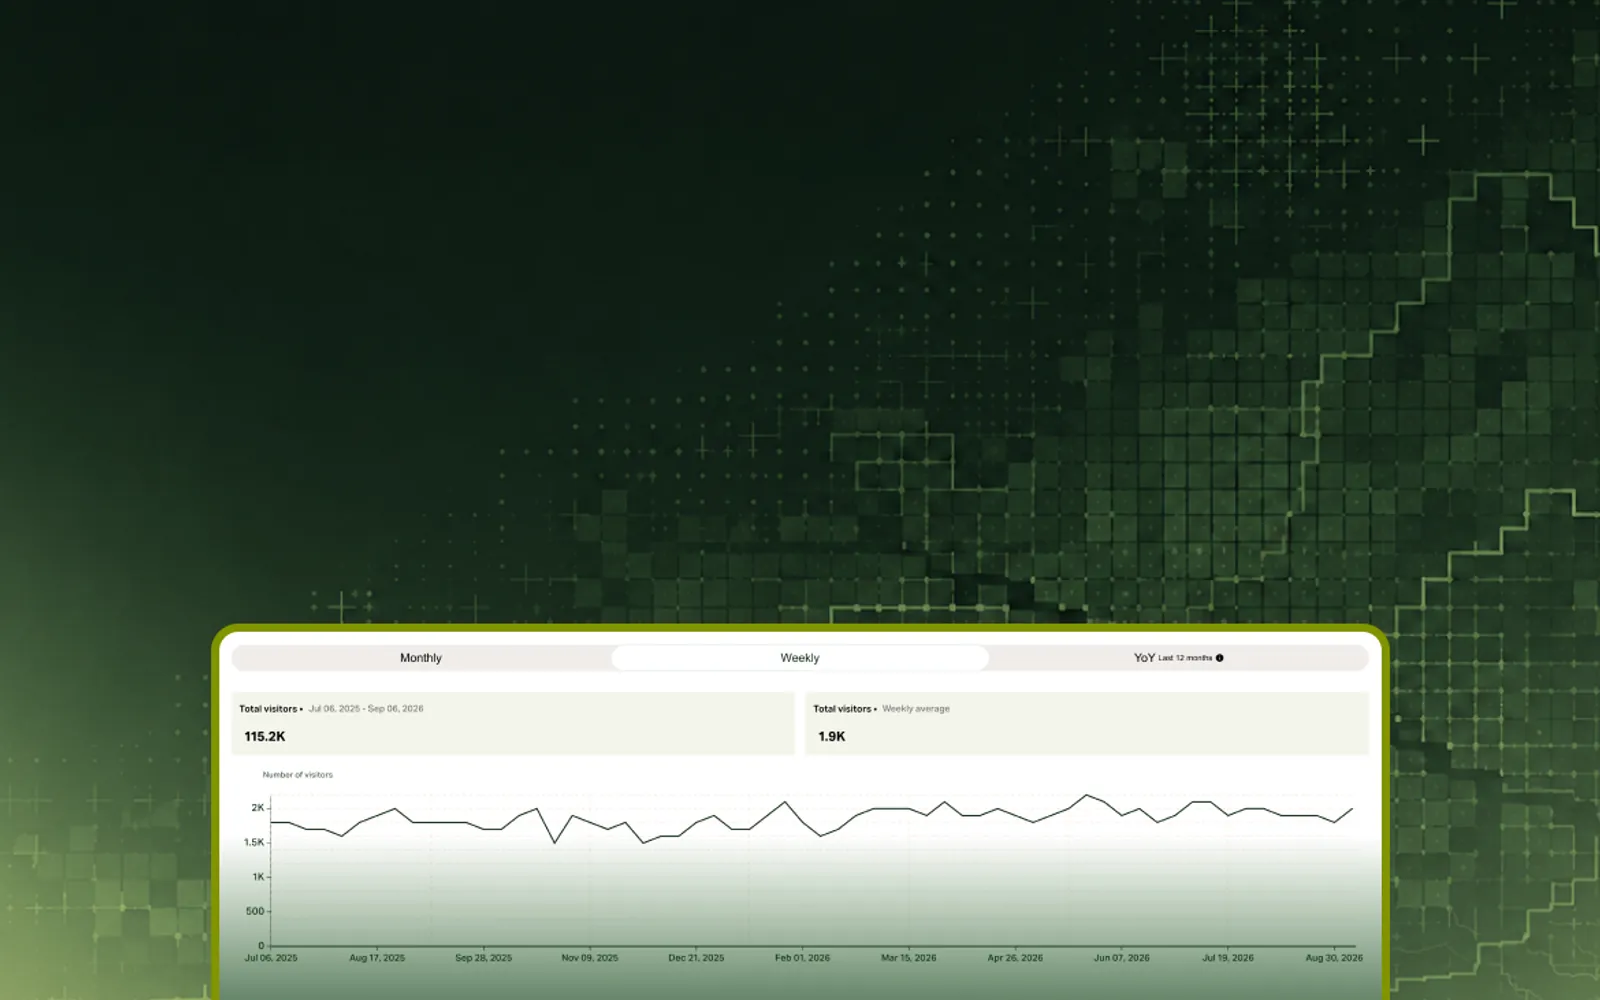
Foot traffic describes the number of visits to a location over a period. It tells the volume, trend and patterns of activity. No other measure is more central to understanding what happens within places and areas.

Frode Bjerke · Principal Engineer, Pine59
Foot traffic is the number of visits to a location over a period of time. A visit is one person spending time at a location, whether a bounded area or a specific place. Add the visits up over a day, a week, or a month and you have the foot traffic for that period.
That is the whole definition, and it applies to a single store as well as to a park, a neighborhood, or a high street. What makes foot traffic useful is that the same number can be read in several ways: how much activity a place gets, when it gets it, how that compares with last year or with the place down the road. With related metrics it also tells who the people are and where they come from.
What foot traffic measures
The animation below follows one grocery store through a day. Each dot is a person. A dot is counted the moment it crosses the location boundary.
What foot traffic reports is the statistics on the right. Pine59 does not report on, and cannot report on, any single dot in this animation.
Four numbers move on the right, and it helps to keep them apart:
| Measure | The question it answers | In the animation |
|---|---|---|
| Visits | How many people came during the period? | The running total for the day |
| Arrivals | How many came in during this hour? | Resets at the top of every hour |
| Departures | How many left during this hour? | Resets at the top of every hour |
| Attendance | How many are inside right now? | The snapshot count |
Of the four values above, visits hold the information required for the vast majority of use cases, and is the metric value which Pine59 focuses on and emphasizes.
Foot traffic for places
A place (opens in a new tab) is a store, a restaurant, a venue: a location with a name, a category, and a boundary polygon. Place foot traffic is the estimated visits to that exact context, not only its polygon, so it can be read against the place’s own history, against the rest of its chain, against its category, and against named competitors, all on the same definition.
The higher the volume of visits, the more resolution we have in the measurement. Expanding the time period improves resolution for many lower-volume locations. In dense environments, several places share a street or a building, and attributing a visit to exactly the right one is not perfect. We use a knowledge-based model to improve performance on individual locations, aimed specifically at dense and low-traffic places. In those settings the model is typically best at places whose traffic pattern largely follows their immediate area.
Visits to a place can also be counted at the door, with beam, camera, or Wi-Fi counters. Those are precise for the doors they sit on and say nothing about the store across the street, the mall, or the neighborhood. Location intelligence estimates visits to every place and area with one method and one definition, including the ones nobody has instrumented, and is less exact for a single door than a counter is. The two are complementary: counters tell you what happened at your own doors, location intelligence puts that in context and extends the same measurement to everywhere you do not own.
Foot traffic for areas
The same measure applies to an area (opens in a new tab): a park, a neighborhood, a downtown, a high street. Here foot traffic describes the volume, timing, and intensity of activity in a space with no doors. It shows whether the area is attracting more people than before, how it compares with other areas, how much activity a specific event drew, how seasons differ, and, within the week, when the area is busy and when it is slow.
For areas, the boundary is the analyst’s choice. Neighborhood grids, administrative districts, and custom polygons are all valid locations. Because an area counts all activity inside its polygon, its absolute counts are steadier than a single place’s.
Where foot traffic is used
Retail performance and competitive intelligence
For a store, restaurant, or service business, visits over time are a direct performance indicator, and one that exists for competitors too. The typical reads are a store against its own history, against the rest of the chain, against the category, and against named competitors on identical windows. Portfolio views rank stores by visits and by trend, and single-store profiles explain why a location behaves the way it does.
Guides: Brand Comparison (opens in a new tab), Store Profiling (opens in a new tab).
Site selection
Before a lease is signed, foot traffic is the demand half of the decision. It screens a whole market for areas with the activity you want, finds locations that look like the ones where you already win, and tests what an area lacks that its demand could support. Measured movement beats resident statistics here because it captures what a place attracts, not only who lives next to it.
Guides: Area Identification (opens in a new tab), Analog Modeling (opens in a new tab), Void Analysis (opens in a new tab).
Cities and urban development
For municipalities, business improvement districts, and developers, area foot traffic is the reporting layer. It tracks a district before and after an intervention against the rest of the city, measures event impact, and surfaces emerging areas: places where activity is growing faster than their surroundings before that shows up anywhere else.
Every guide above ends in a worked example with real results. Explore the Pine59 Console & API docs: guides, examples, datasets, concepts, and APIs.
Start buildingFoot traffic says what happened. Related metrics say why and how.
Foot traffic on its own tells you how many and when. The metrics built on the same observations explain the number:
- Trade areas (opens in a new tab) show where visitors come from, and whether a place serves its neighborhood or draws from across the metro.
- Visitor demographics (opens in a new tab) and visitor profiles (opens in a new tab) describe the audience a place attracts, based on visitors rather than residents.
- Visitor journeys (opens in a new tab) show which other places are part of the same trip, including competitors visited on the same day.
- Popular times give the busy-hours profile of a typical week.
“A drop in visits is a fact. The trade area shrinking on one side, or a competitor entering the same journeys, is the explanation.”
How Pine59 models foot traffic
Foot traffic is built in three steps. The details differ by model and market: place foot traffic in the US, for example, is a knowledge-based machine-learning model in which pre-aggregated signal observations are one of many feature inputs. The three steps are the shape they share.
Observation. A panel of devices shares location signals. When a device is inside a location’s boundary for a sustained period, that is a visit. Passing by is not a visit, and neither is a single momentary ping. For Pine59, this step happens inside the first-party data owner: the app publisher for GPS location data, the mobile operator for network data. Individual signals stay in their clean rooms, and what reaches us is already aggregated.
One person, one visit. Visits are counted per person per day. Someone who comes in twice on the same day is one visit that day. The goal is a count of people, treated as interchangeable: the metric says how many, not who.
Extrapolation. The panel is a sample. Counts are scaled to represent the full population, so a foot traffic number reads as an estimate of real-world visits, not as a count of observed devices. The bigger the crowd, the smaller the relative error band: a busy place or a whole area is estimated tightly, a low-traffic place on a single day is not, and for those the monthly read is the one to trust. Two consequences follow. Directional trends and rankings are more accurate than absolute counts. And absolute counts are better for areas, which capture all activity within a polygon, than for a specific store, where size and the density of its surroundings matter.
The most robust read of all is the relation between two locations in the same region or sub-market over the same period. A change in that ratio is typically a very strong signal, because everything the panel adds affects both sides alike.
Foot traffic from Pine59
We offer aggregated location intelligence foot traffic as two metrics, one per location type.
- Place foot traffic (opens in a new tab): visits per store or venue in the US at daily, weekly, and monthly cadence, with trade areas, visitor profiles, journeys, and popular times on the same locations.
- Area foot traffic (opens in a new tab): visits to neighborhoods, districts, and custom polygons in the US and the Nordics, with visitors split into residents, workers, and other visitors where the signal supports it.
The data is available through the API, in bulk exports, and in Console without code. Our docs open with Make your first query (opens in a new tab) and Use Pine59 without code (opens in a new tab), and every guide linked above ends in a worked example with real results.
Want to see what foot traffic shows for your locations or markets?

Privacy by design: from location data to location intelligence

Kjartan Slette · October 23, 2026
What is a catchment area? Definition, methods and how to measure it

Izabela Szymczyk · September 8, 2026
Location data vs. location intelligence (and aggregated vs. device-level)
Kjartan Slette · September 8, 2026

Turn aggregated location intelligence into competitive advantage
Discover how Pine59 can power your analytics, products and AI with statistical insights about places and populations.