
October 20, 2026
Why choose Pine59 as your next location intelligence partner
Pine59 answers the same core questions as other location intelligence platforms. What sets it apart: how the counts are made, how stable history stays, what customers may do with the data, and an API built for AI workflows.

Tor Åge Ballo · Co-founder, Pine59
Pine59 and other location intelligence providers are built for the same job: understanding how physical places and areas perform using mobility data.
Pine59 provides the same core capabilities as other location intelligence platforms. This is typically measuring visitation, comparing locations, and understanding how places perform over time and relative to their surroundings.
Most providers start from a sample of observed devices and estimate broader visitation. The numbers will not match one-to-one. Data suppliers, coverage, and methodologies differ. But the questions the data answer are largely the same.
The same core analyses
At their core, location intelligence platforms help businesses understand what's happening in the physical world.
Whether you're using Pine59 or another provider, the fundamental analyses are similar:
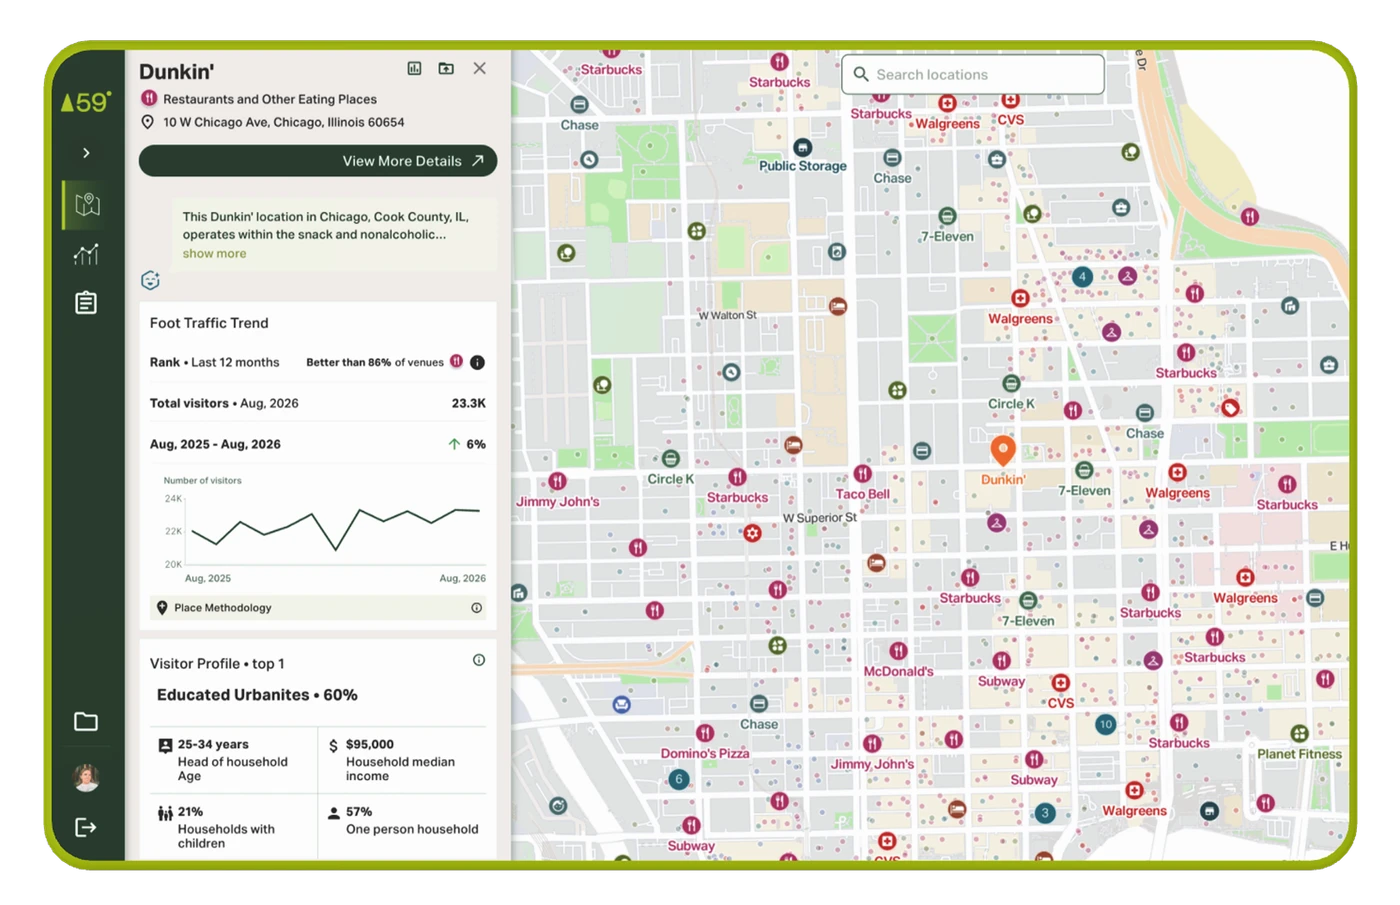
- How a place or area is trending over time
- How a place or area compares to its neighborhood
- How a place or area compares to brand and category baselines (opens in a new tab)
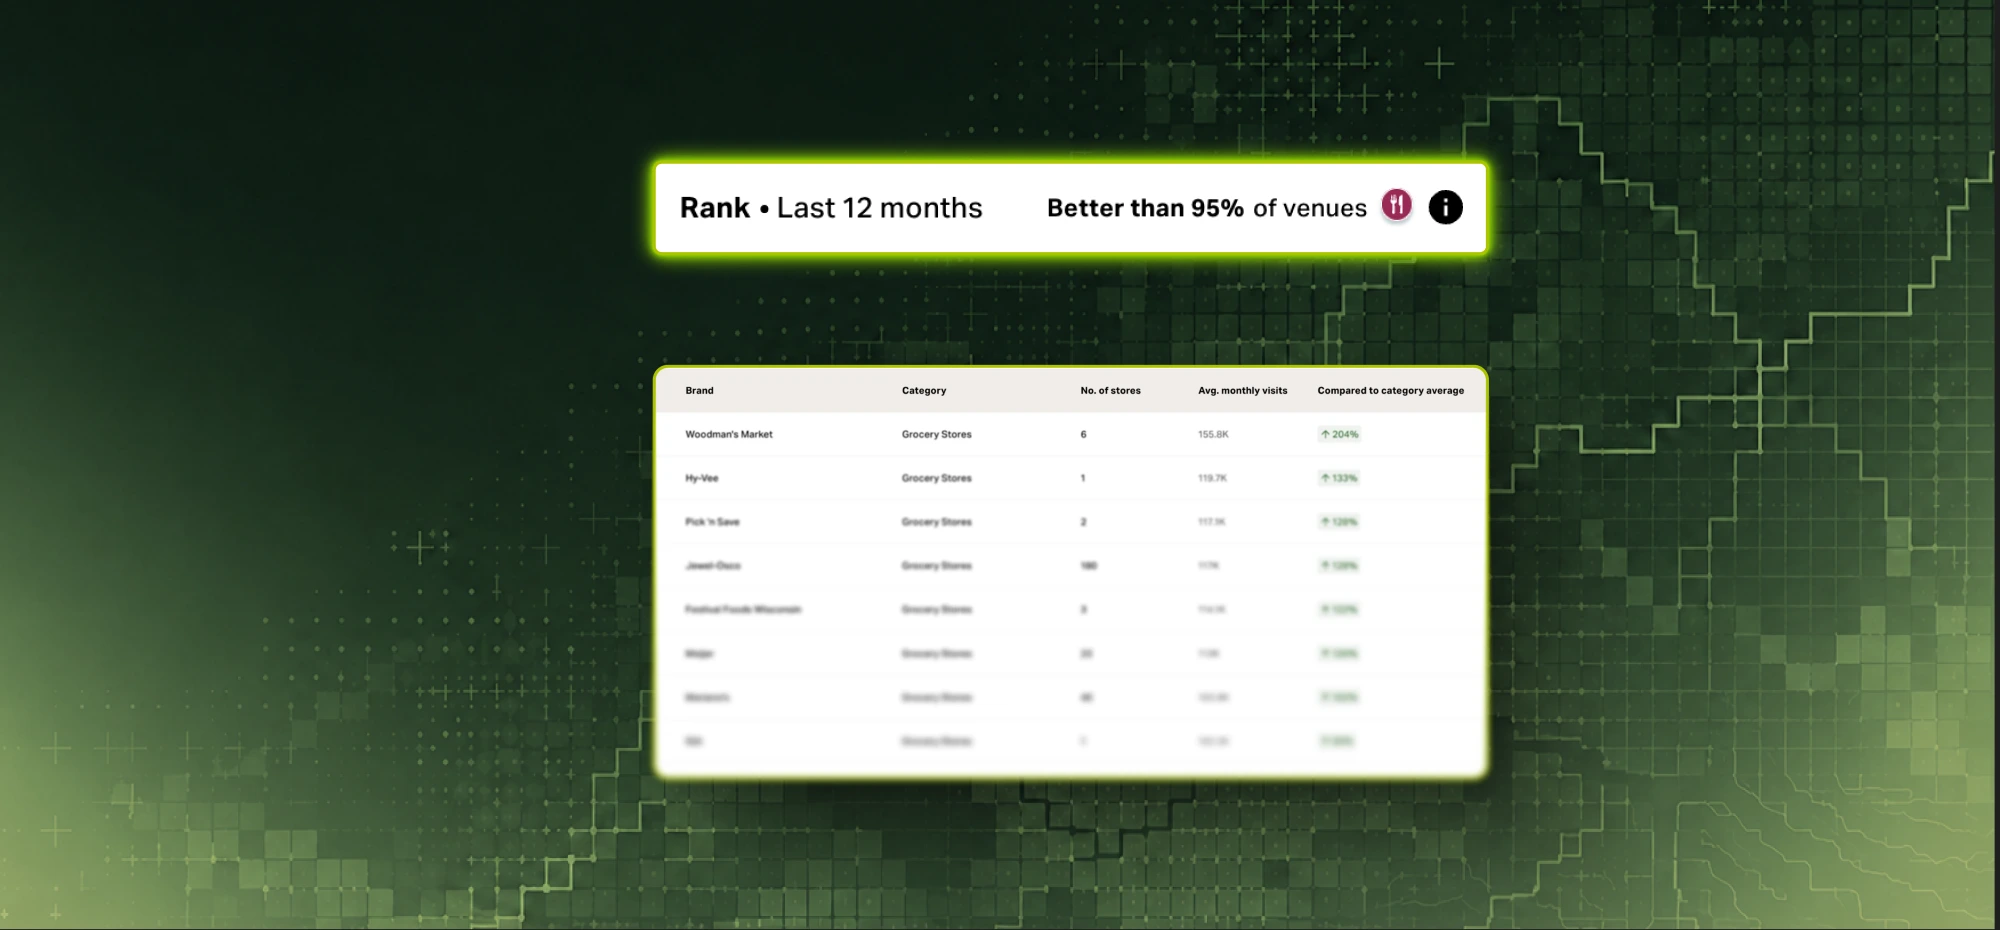
- How places and areas rank against each other
- How a brand or category is performing overall
These are the questions that matter when evaluating retail locations, understanding market performance, or comparing physical places.
The same ways of working
The way teams access and work with location intelligence data is also broadly similar.
Pine59 and other providers offer dashboards for everyday exploration, alongside APIs and data services for teams that want to bring the data into their own systems.
Both approaches support working with catalogs of existing places and areas, as well as defining custom locations, whether that's a single place or a drawn geographic area.
The fundamental choice is the same: explore the data through a dashboard or integrate it directly into your own workflows.
Where Pine59 differs
While the purpose and core analyses are similar, there are important differences in how the data is produced, delivered, and used.
A focused dashboard
The Pine59 Insights dashboard (opens in a new tab) is built to answer questions across our main use cases in retail, real estate and public sector.
Some other location intelligence providers offer more complex dashboards with additional specialized functionality. Pine59 takes a more focused approach, prioritizing the analyses most relevant to its users.
An API built for AI workflows
Pine59 is built for the AI future.
Teams can generate and manage their own API keys (opens in a new tab) through a self-serve platform and pull location data directly into the tools and systems they already use.
Documentation, guides, and examples (opens in a new tab) are openly available, making it straightforward to integrate the same data into traditional applications, AI workflows (opens in a new tab), or autonomous agents.
As more analysis moves from dashboards into AI-powered tools, having an accessible, well-documented API becomes increasingly important.
Data usage and rights
Another practical difference is what customers are allowed to do with the data.
Pine59's contract terms allow data to be shared outside the organization, so the same numbers can support client-facing work as well as internal analysis.
This matters for agencies, consultants, technology providers, and other businesses building services around location intelligence.
Visitation counts and methodology
Absolute visitation estimates come from different methodologies, data sources, and geographic polygons. Ours is trained on ground truth (opens in a new tab) from retail partners, public attendance data and national park visits, among other sources, and draws only on verified first-party supply (opens in a new tab).
This means raw counts from different providers should not be expected to line up exactly. Trends, comparisons, and rankings are best interpreted consistently within the same system.
Stable historical data
Published history stays put in Pine59.
Historical estimates change only when major model updates are introduced, and when they do, we tell customers in advance what changed and why. This provides a more stable foundation for teams tracking performance over time, building recurring reports, or using location intelligence in their own products.
Other practical differences
Beyond the core product experience, several differences are worth understanding.
Panel composition. Pine59's panel is similar in size to those of other major providers but built differently, combining signals from multiple apps and partners.
Place coverage. Pine59's place catalog (opens in a new tab), powered by SafeGraph, includes extensive business coverage across the United States, tagged by brand and category and refreshed monthly in close collaboration with our supplier. Any place not in the catalog can be added as a custom location, fully self-served.
Data releases and confidence. Metrics are published on a controlled cadence. Foot-traffic estimates available through the API also include confidence scores, helping users understand the reliability of individual estimates.
Time granularity. Some location intelligence providers offer hourly visitation estimates and daily trade area and demographic data. Pine59 works with more aggregated time frames.
Geographic coverage. Both Pine59 and other major providers cover the United States. Pine59 also offers comparable location intelligence products in the Nordics and the United Kingdom, developed with telecom partners.
In short
Pine59 and other location intelligence providers serve the same fundamental purpose. They answer the same core questions about physical places and areas, and they offer the same basic choice between dashboard exploration and API integration.
The differences lie in the methodology behind the counts, the stability of historical data, the breadth of dashboard functionality, the granularity of available metrics, and the rights customers have to use and share the output.
| Pine59 | |
|---|---|
| Dashboard | Focused on the questions behind retail, real estate and public sector work |
| API | Self-serve keys and open documentation, built for AI workflows and agents |
| Usage rights | Data can be shared outside the organization, for client-facing work |
| Visitation counts | Trained on ground truth, drawing only on verified first-party supply |
| Historical data | Stays put; changes only with major model updates, announced in advance |
| Confidence | A confidence score on foot traffic estimates in the API |
| Time granularity | More aggregated time frames than hourly or daily |
Pine59 combines a focused dashboard with stable historical data, flexible usage rights, and a self-serve API designed for modern data applications.
The API is openly documented (opens in a new tab) and ready to use in existing systems, AI workflows, and agents.
The goal is straightforward: make location intelligence easier to access, integrate, and put to work.




Turn aggregated location intelligence into competitive advantage
Discover how Pine59 can power your analytics, products and AI with statistical insights about places and populations.