








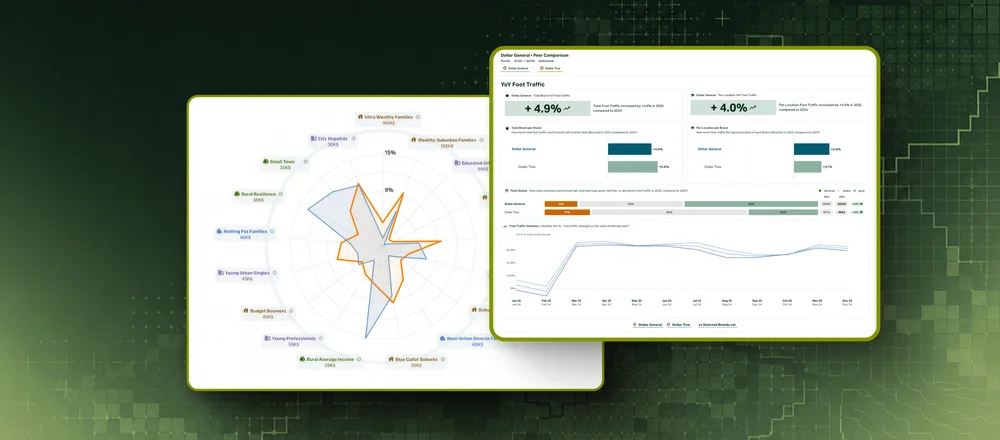

See what your sales data can't
Sales show who bought. Pine59 shows who visited, and how each store does against its competitors.
Unacast’s Aggregated Location Insights business is now Pine59
Read more here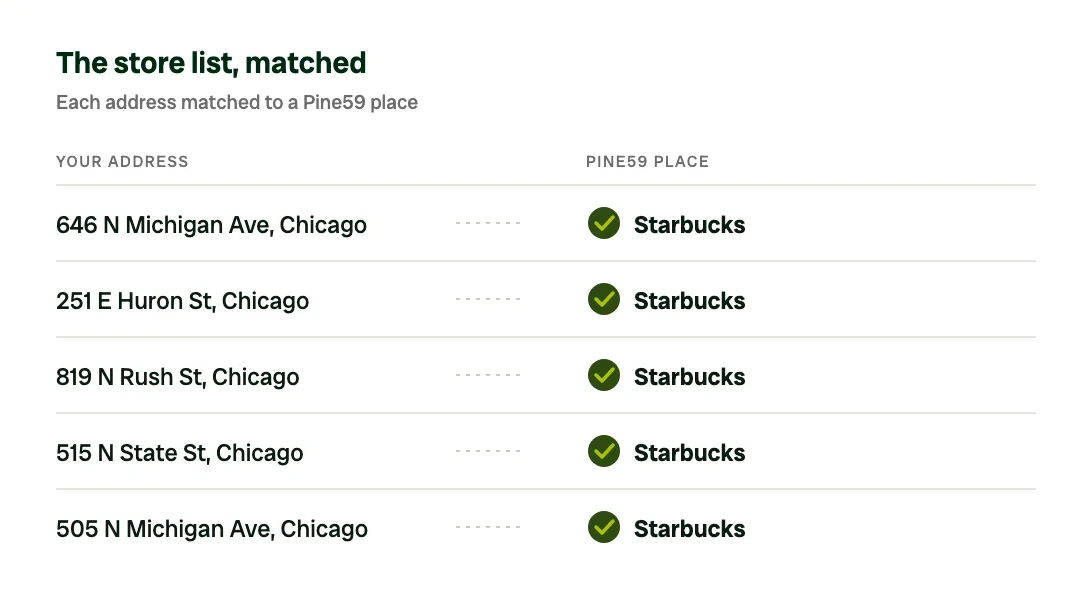
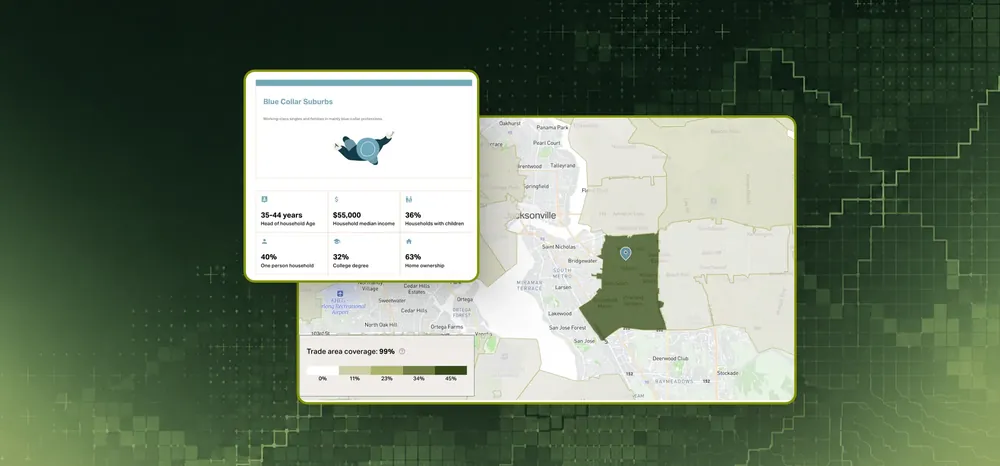
Share of visitors by home ZIP code
 Thomas WalleSeptember 8, 2026
Sales show who bought. Pine59 shows who visited, and how each store does against its competitors.
Export a store, a comparison or a whole Brand Report as a PDF.
Start with no code. The API brings the same numbers into your own dashboards.
Make your first query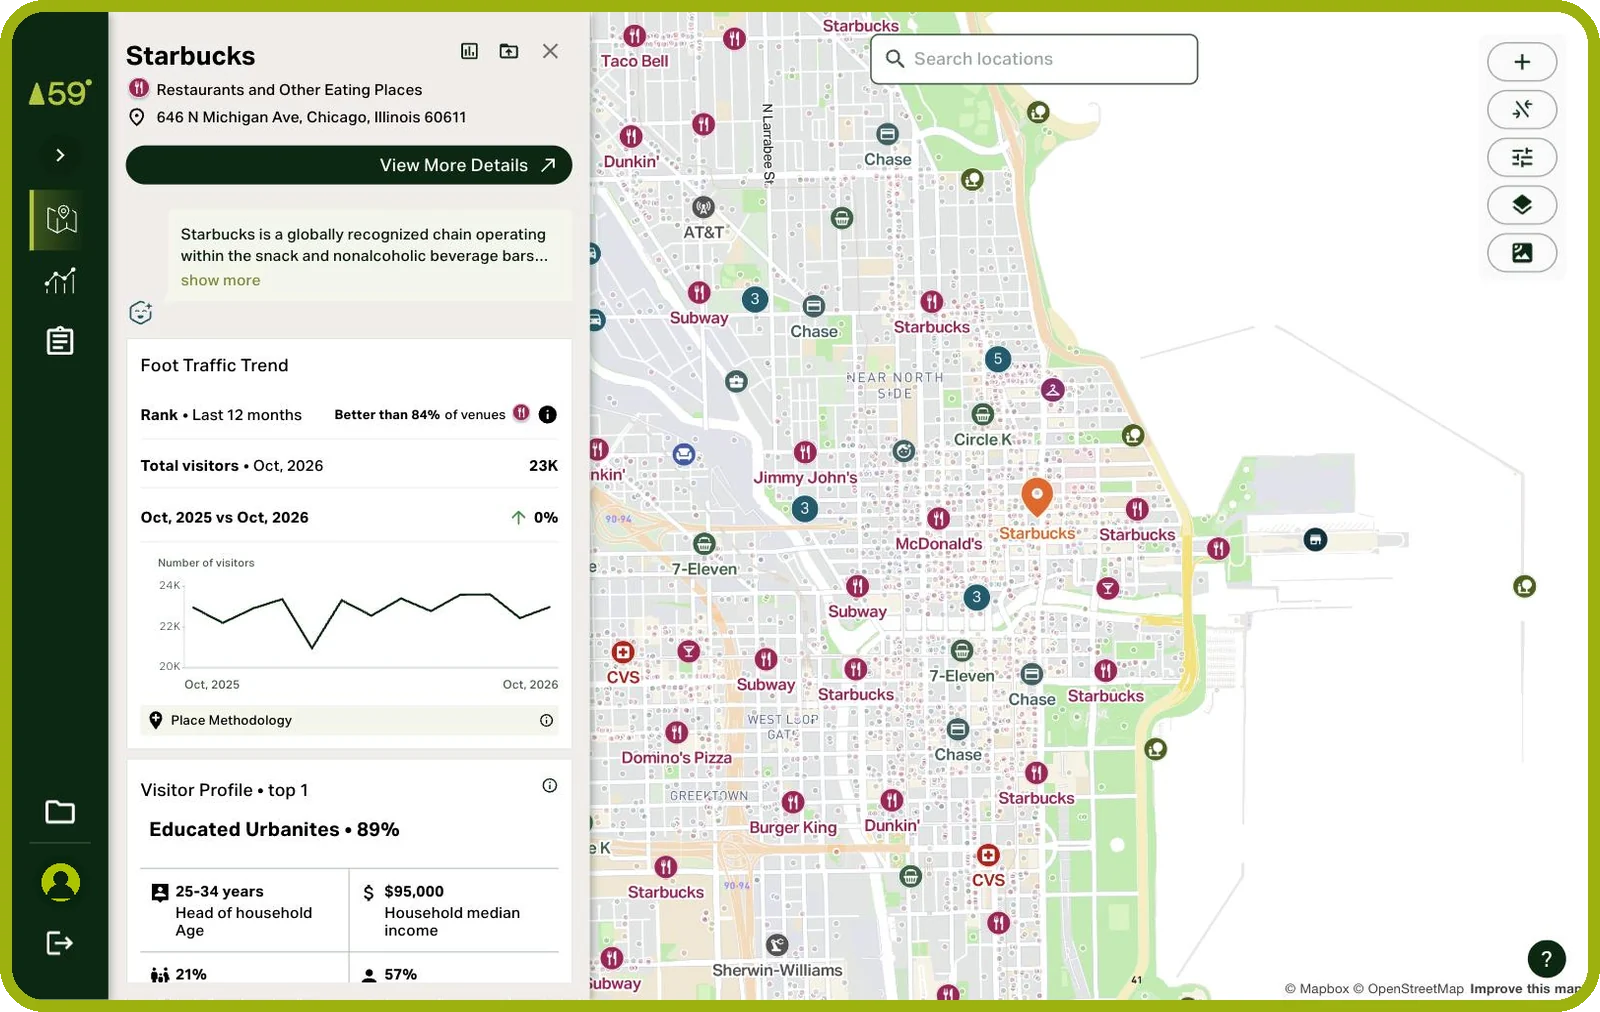
Every field in each US dataset and how often it updates.
Browse the US datasetsEvery request and the response it returns.
Open the API referenceWhat one visit means in our numbers.
Read the visit definitionAggregated at the source, never about individual people.
See how privacy worksSales show what each store sold. Foot traffic adds how many visits each store gets, who its visitors are and where they come from, and how each store compares with its competitors and with last year. It also shows the busiest days and hours, how long visitors stay and where else they go.
They stay as they are until Pine59 announces a change. When an improvement touches past numbers, the release log says what changed and what to do.
Weekly foot traffic usually arrives on Thursdays, and monthly within the first 2 weeks of the month. US history goes back to January 2019.
Yes. Each store sits against the competitors around it and its category, with where it ranks, and the brand against its peers across the US, in a state or in one metro.
Grocery brands compared, in the DocsYes. Trade areas show which ZIP codes each store's visitors live and work in, and demographics show who they are, so campaigns go where the visitors are. The same trade areas come as data for the tools you or your agency already use.
How trade areas work, in the DocsYes. Find the areas that look like your best stores, and the gaps where competitors already prove the demand.
Candidate malls compared, in the DocsRead the brand as a whole against its peers, and each mall as a place: who it draws, where its visitors live and how it ranks. A single store inside a mall reads best as part of the brand.
The store and brand comparisons here are US only. In Norway, Sweden and Finland, places come daily and monthly, back to 2023.
Every dataset by market, in the Docs