









Track how every location performs
How are our locations doing?
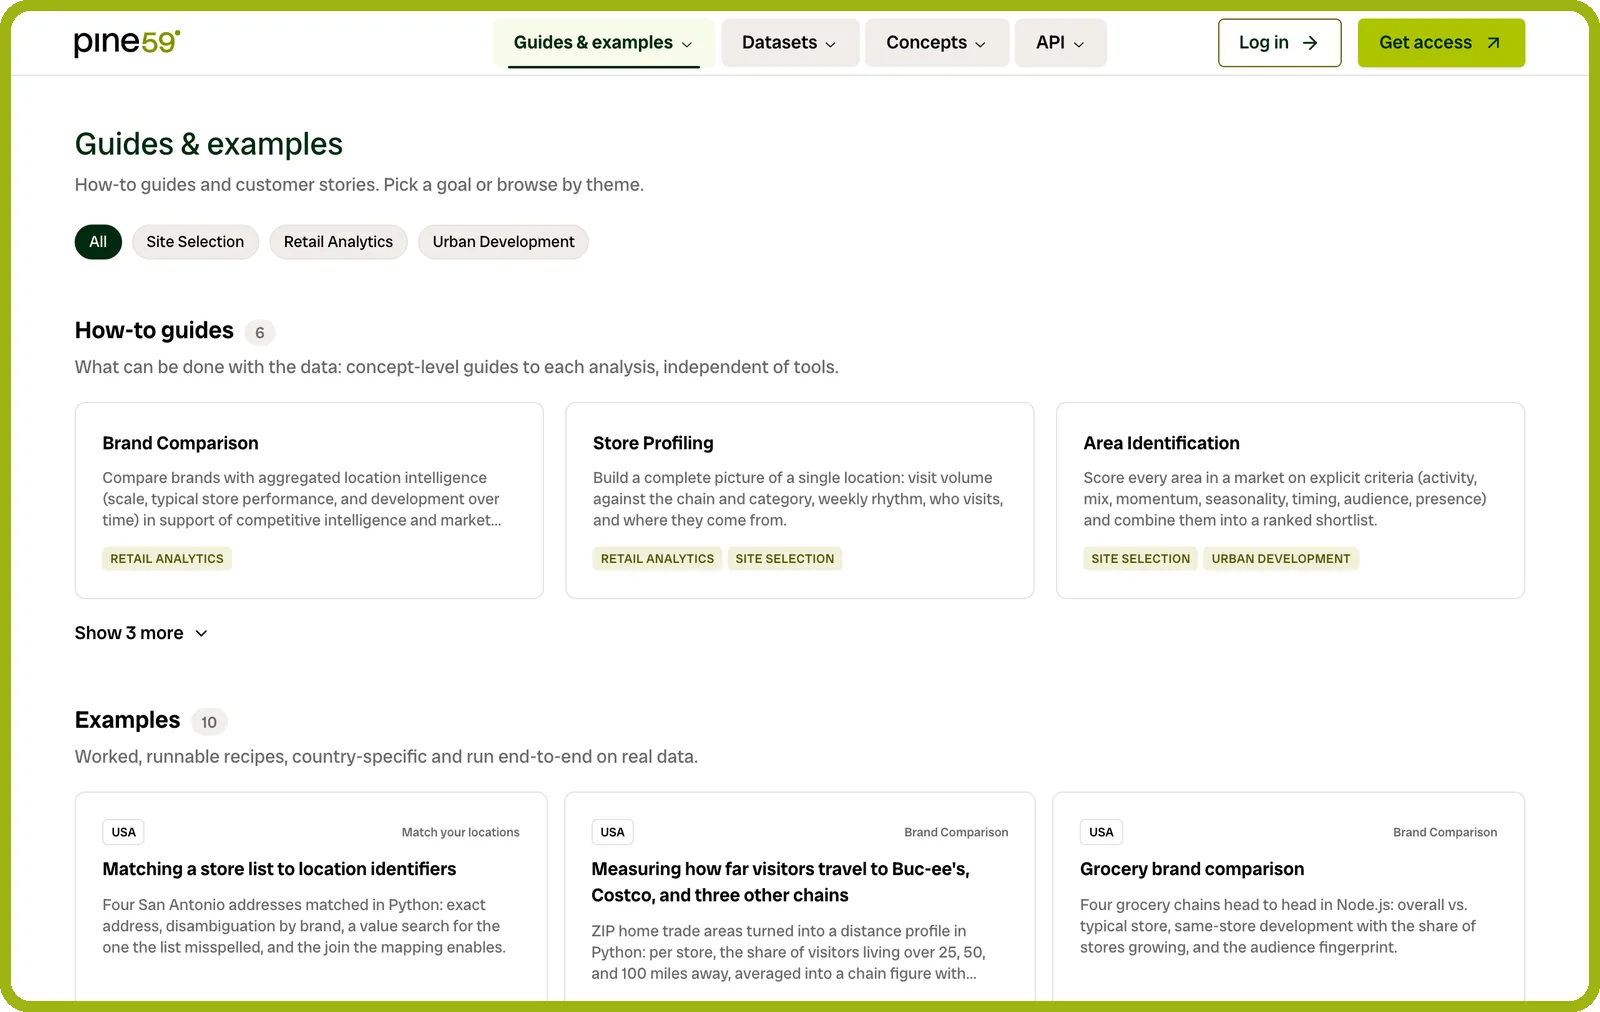
A guide for every question
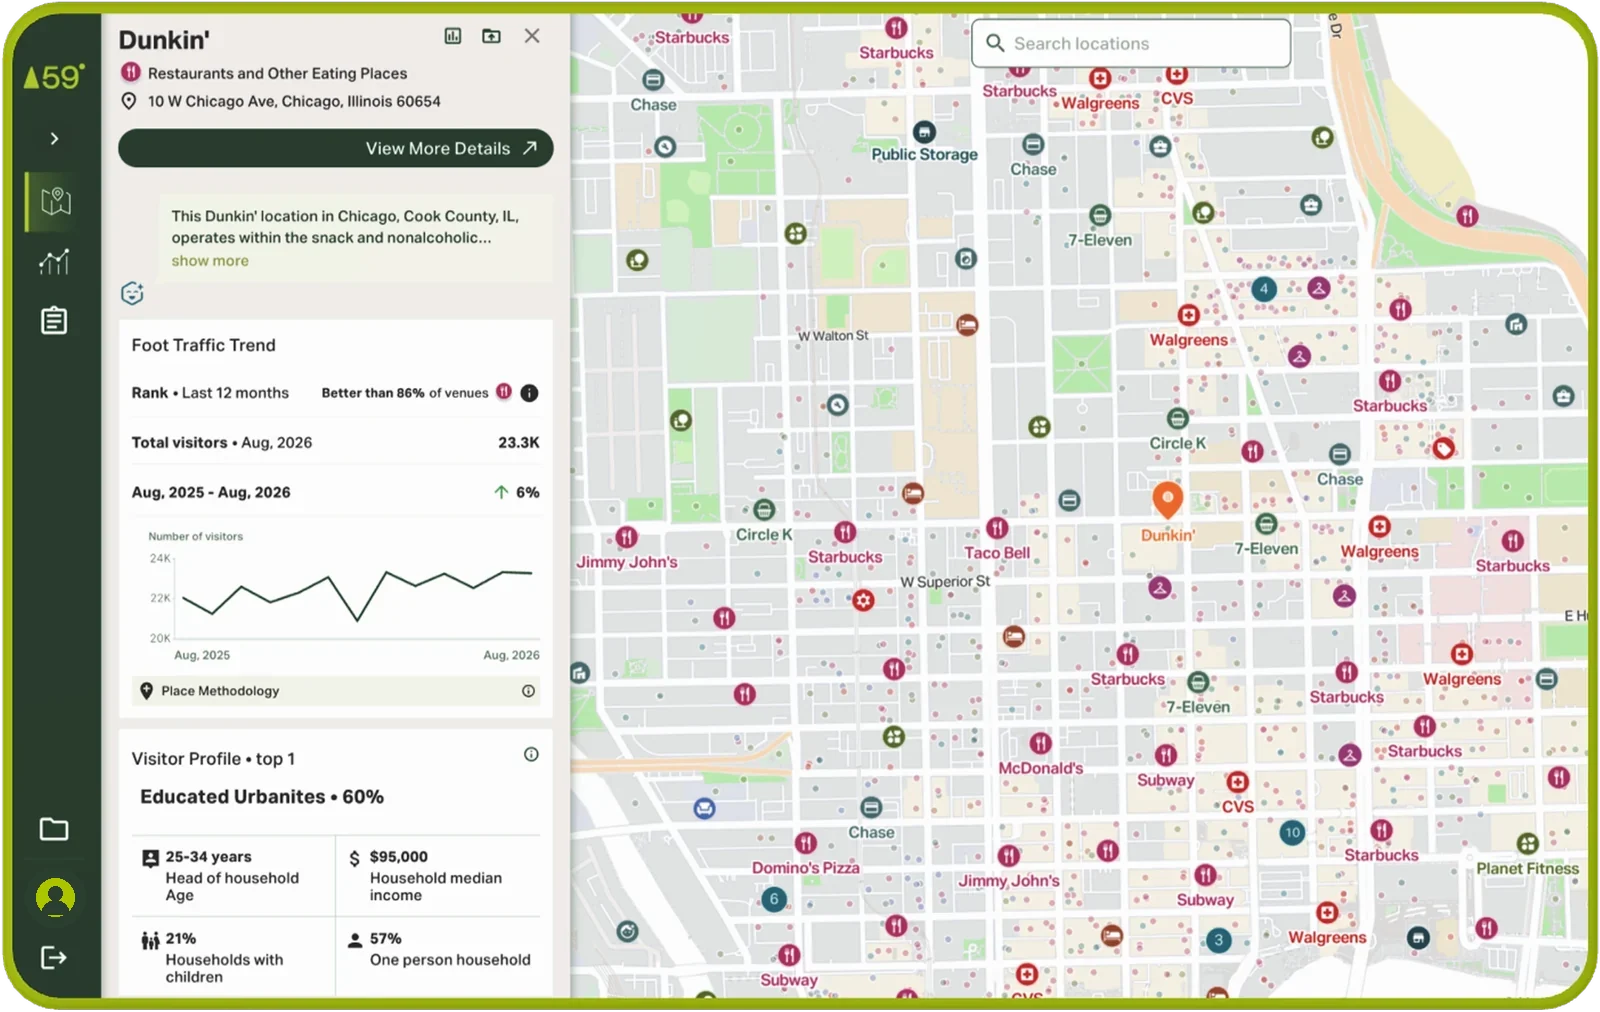
 Profile any placeA store, mall, venue or park: its visits and visitors, against its chain, competitors and category.Store Profiling, a worked example in the Docs
 Compare brandsEach brand's size, its typical location and how it develops over time.Brand Comparison, a worked example in the Docs
 Report on an areaA street, a downtown or a park, month after month or before and after a change, against a benchmark.Area Development Reporting, a worked example in the Docs
Worked examples on real locations
- Profile any placeProfiling an H-E-B store in San AntonioSan Antonio, US
- Compare brandsHow far visitors travel to Buc-ee's and CostcoUS
- Compare brandsComparing grocery brandsUS
- Report on an areaReporting the 16th Street reopeningDenver, US
- Report on an areaTracking Grünerløkka's district trendOslo, Norway
Start with the Docs, then choose how to work with the data.
See how every number is made
Foot Traffic clearly defined
What one visit means in our numbers.
Read the visit definitionPrivacy built in
Aggregated at the source, never about individual people.
See how privacy worksTerms published in full
What a customer can do with the data, including sharing it with credit to Pine59.
Read the termsBefore getting started
Trusting the numbers
Sales show what each location sold. Foot traffic adds how many visits each location gets, who its visitors are and where they come from, and how each location compares with last year, the area around it and its competitors. It also shows the busiest days and hours, how long visitors stay and where else they go.

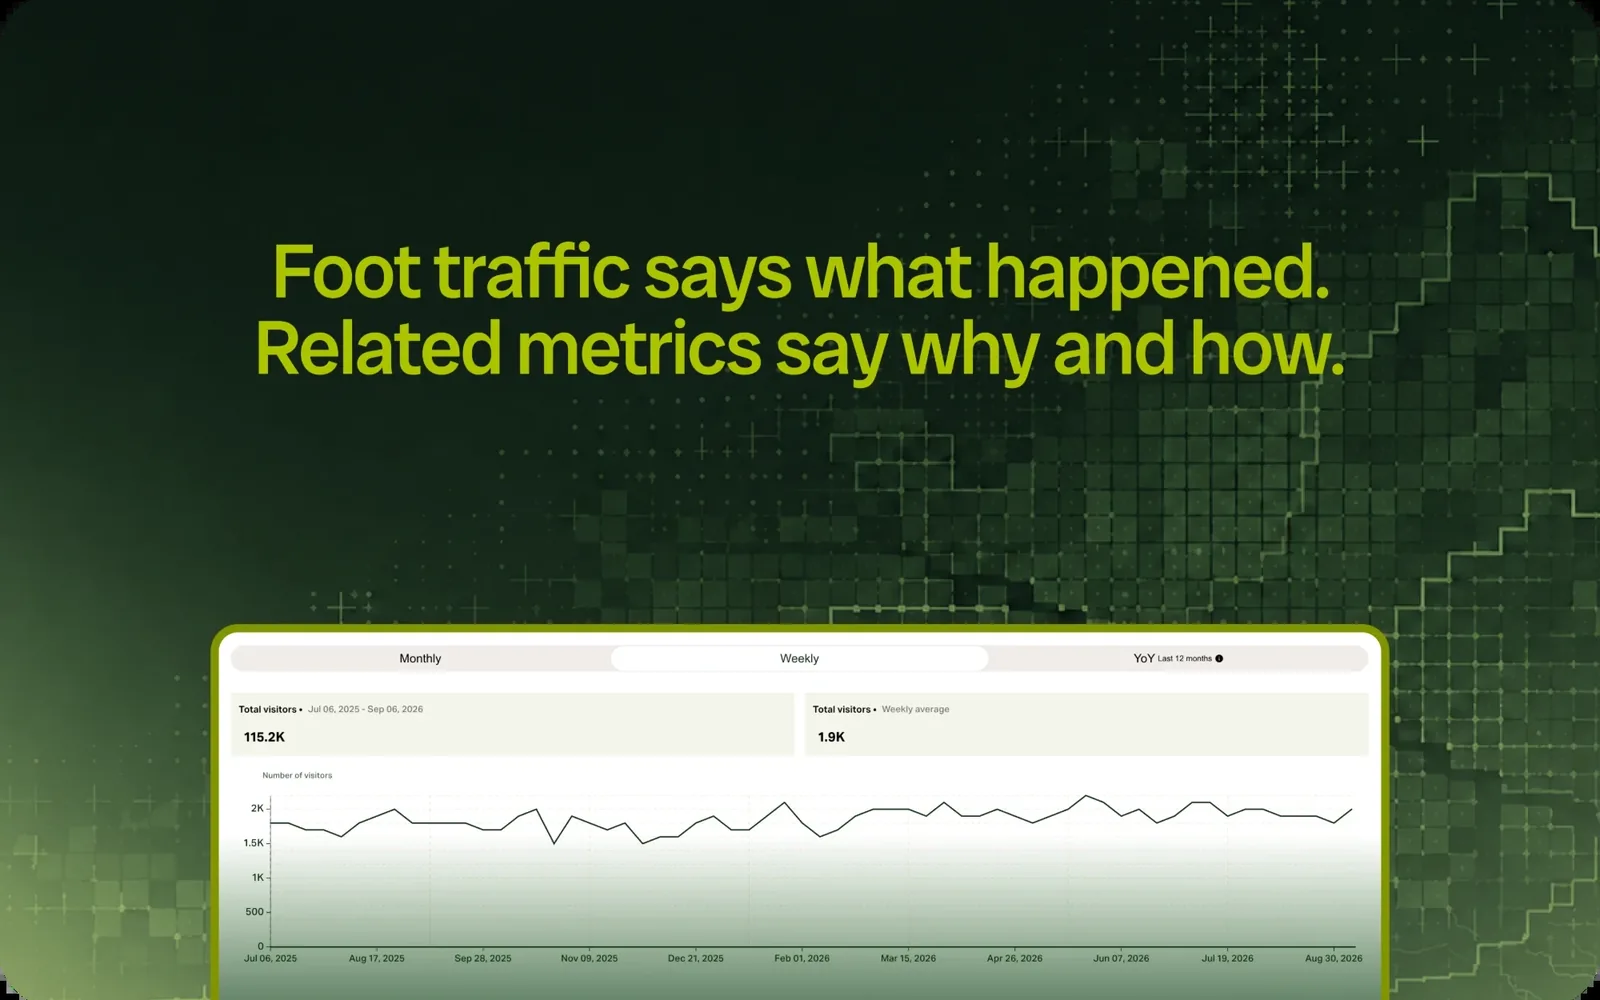
Its own past first, then a benchmark that moves with the market: its chain, competitors and category, or, for a street or an area, the city around it.
A location profile, worked through in the DocsNo. Foot traffic is aggregated at the source. Small groups are held back, and customers never receive device identifiers or movement histories.
How privacy is built in, in the Docs
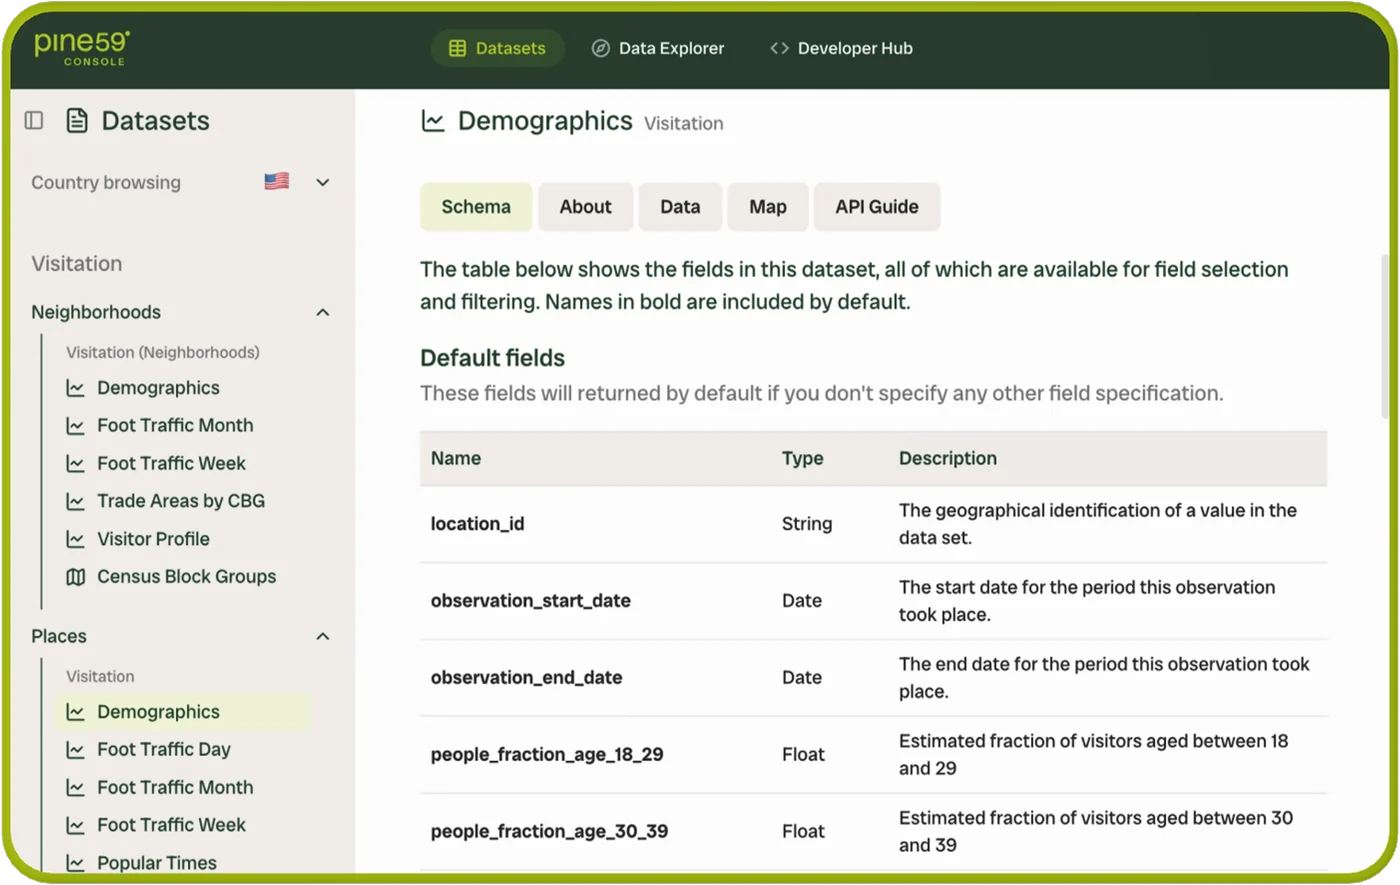
In the US, weekly foot traffic usually arrives on Thursdays and monthly within the first 2 weeks of the month, with history back to January 2019 for daily, weekly and monthly foot traffic and for the quarterly trade areas, demographics and visitor profiles. In Norway, Sweden, Finland and Estonia, history goes back to 2023.
Using the data
In the US, yes. Each location sits against the competitors around it and its category, with where it ranks, and the brand against its peers across the US, in a state or in one metro. Foot traffic shows how competitors' locations are visited, not their sales or prices.
Grocery brands compared, in the DocsYes. Compare the months before, during and after the work: how many visits the place gets, who its visitors are and where they come from. Compare the area around it too, so you can tell what the work changed from what changed everywhere.
A rebuilt street, worked through in the DocsYes, for every place in Pine59's places directory, about 4 million places in the US. Match the list once by address, brand or name, and foot traffic, trade areas and visitor profiles all join on the same location ID. A location that isn't in the directory can be added as a custom location, in Insights or through the API as an enterprise service.
Matching a list of locations, in the DocsPlaces and markets
The location and brand comparisons here are US only. In Norway, Sweden and Finland, places come daily and monthly, back to 2023.
Every dataset by market, in the Docs
Months, quarters and years read best: holidays compare month against month, and small places read best weekly and monthly. Inside a mall, the mall and the brand read well; single stores inside it aren't read one by one.

Bring your places.See how they perform.
- 01Your use case
- 02A short meeting
- 03Trial the data
- 04Sign and go live