








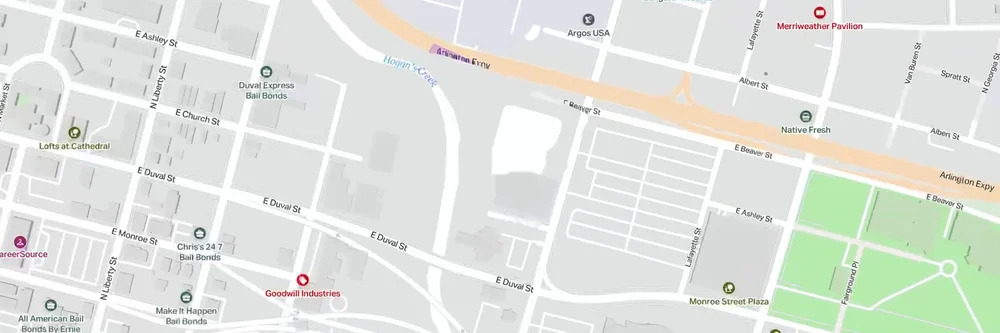
Data on any location
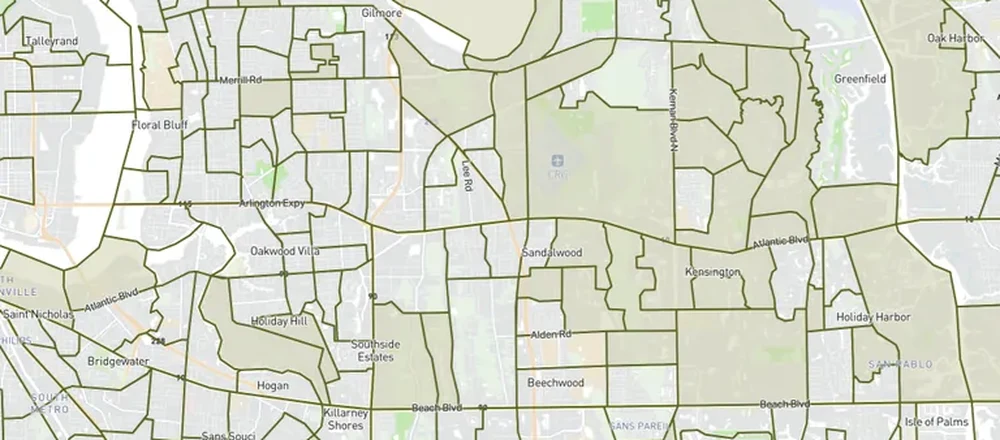
Add any park, main street or downtown as a custom location, and get its data.
Unacast’s Aggregated Location Insights business is now Pine59
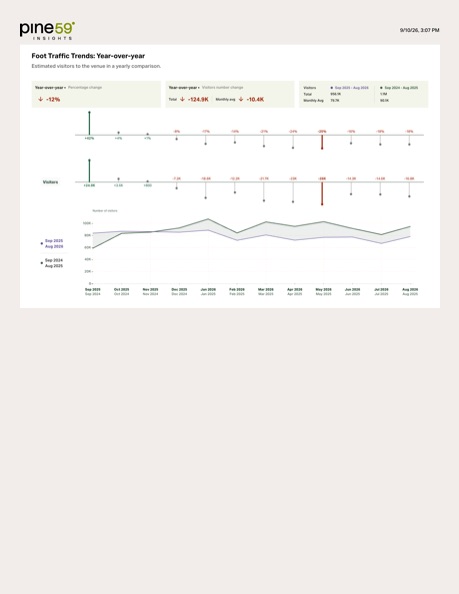
Read more hereVisits against last year
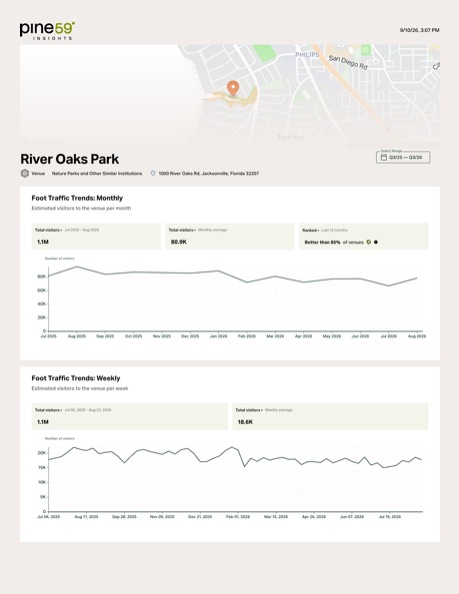
Add any park, main street or downtown as a custom location, and get its data.
US history back to 2019, so every year compares with the ones before.
Use them in reports, grant applications and public dashboards, credited to Pine59. Aggregated at the source, never about individual people.
Read the terms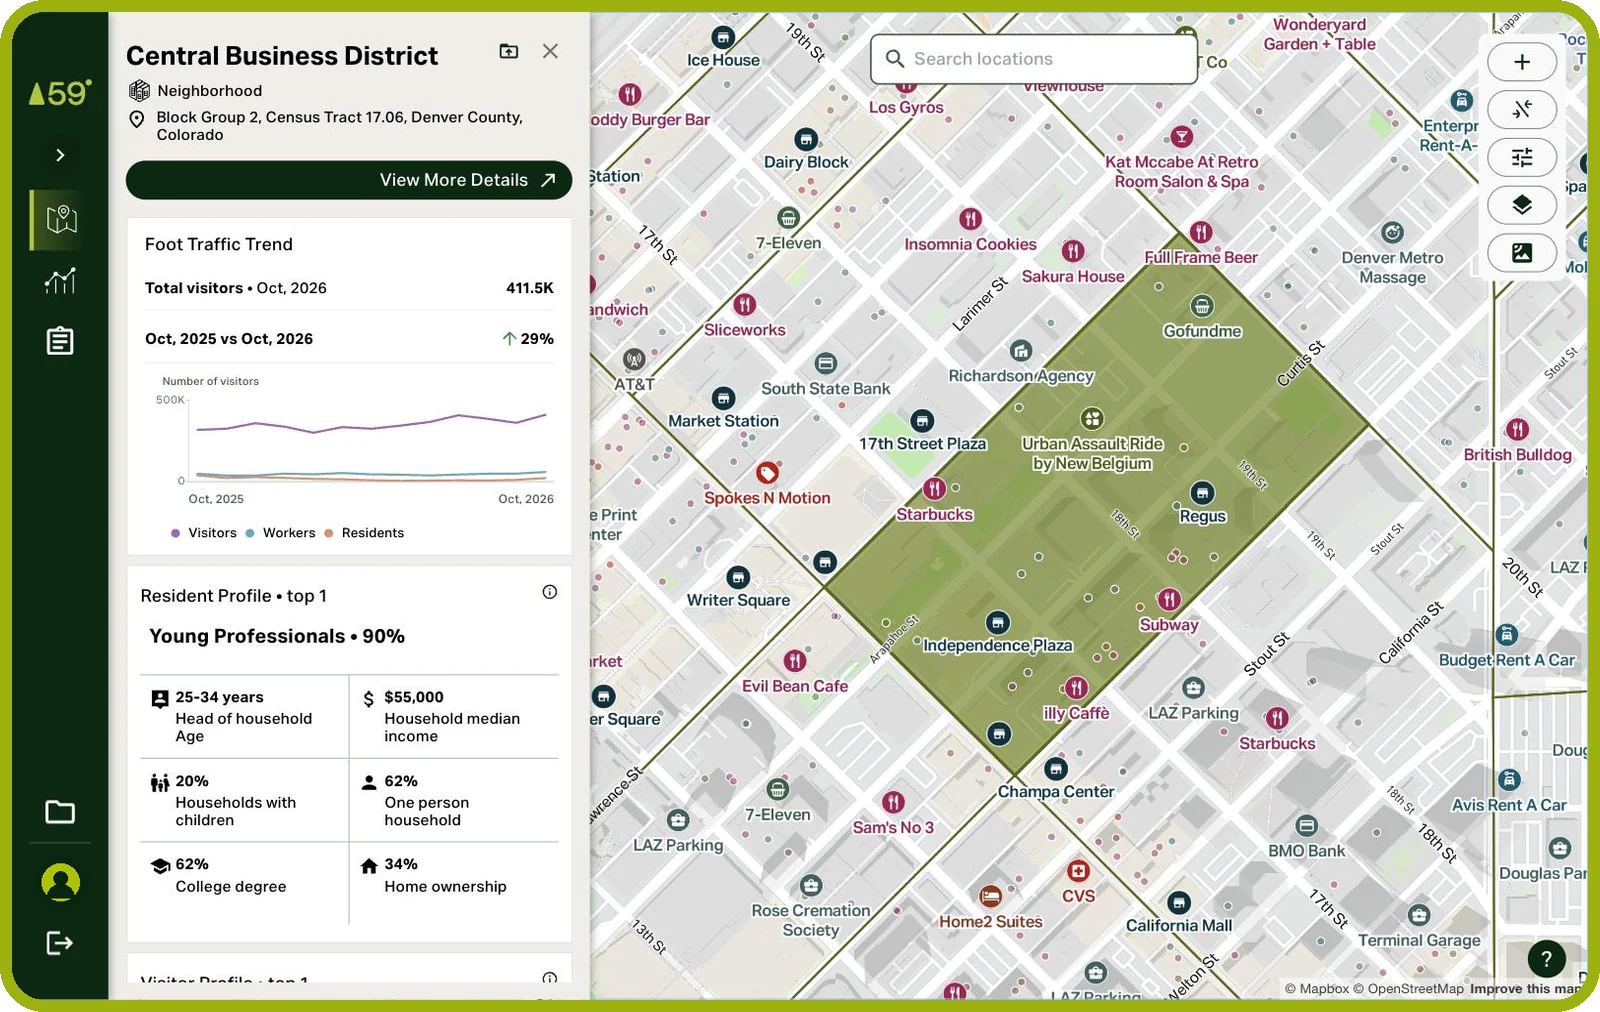
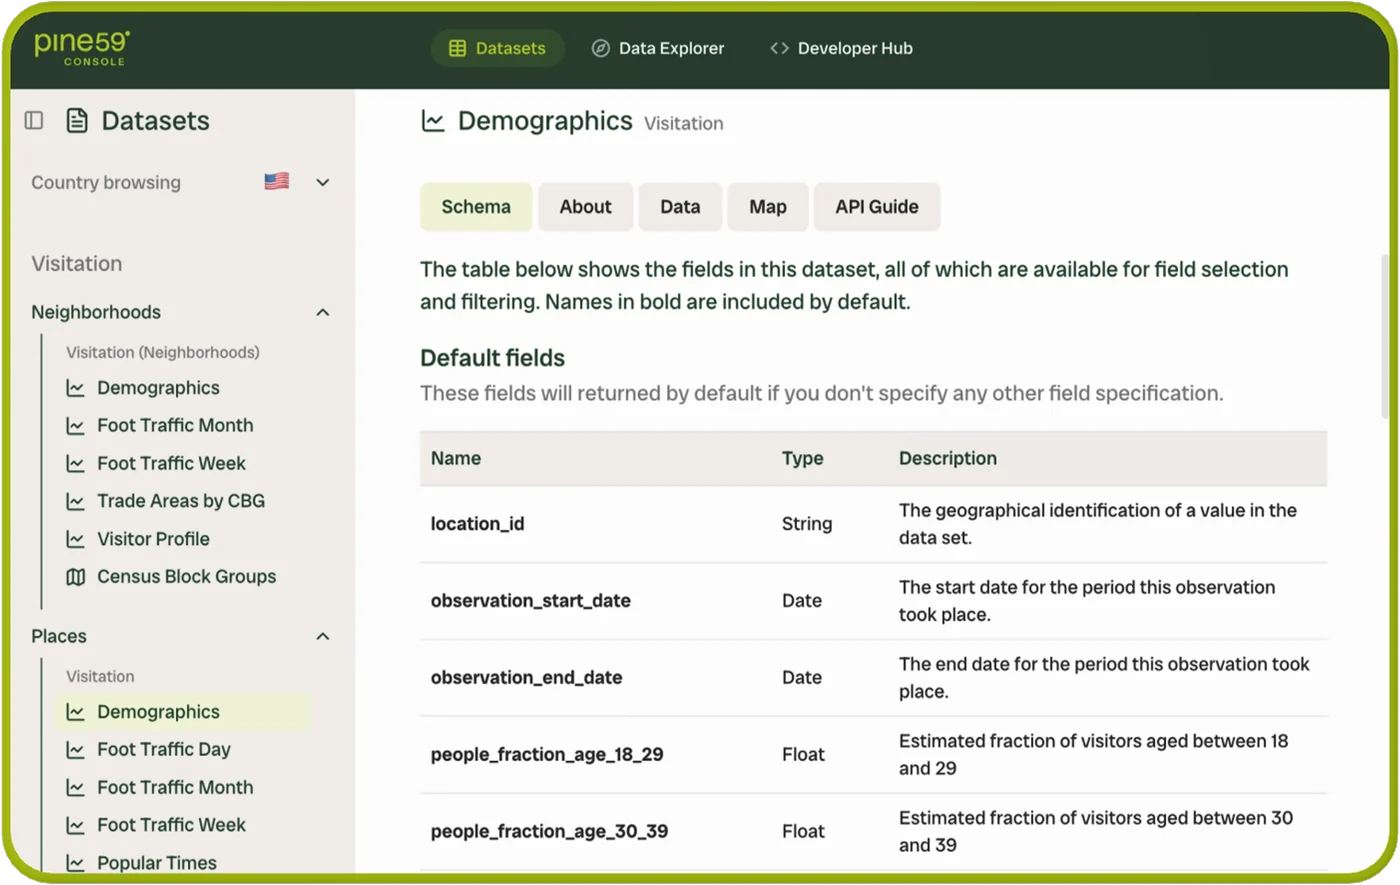
Every field in each US dataset and how often it updates.
Browse the US datasetsEvery request and the response it returns.
Open the API referenceWhat one visit means in our numbers.
Read the visit definitionAggregated at the source, never about individual people.
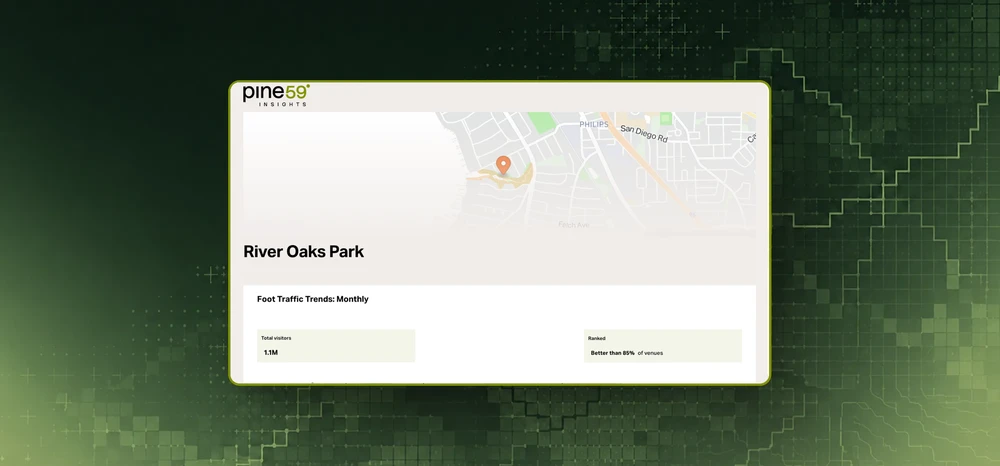
See how privacy worksA year-round view of each place: how many visits each park and street gets, where visitors come from, and how each place compares with your others and with last year. It also shows the busiest days and hours, how long visitors stay and where else they go.
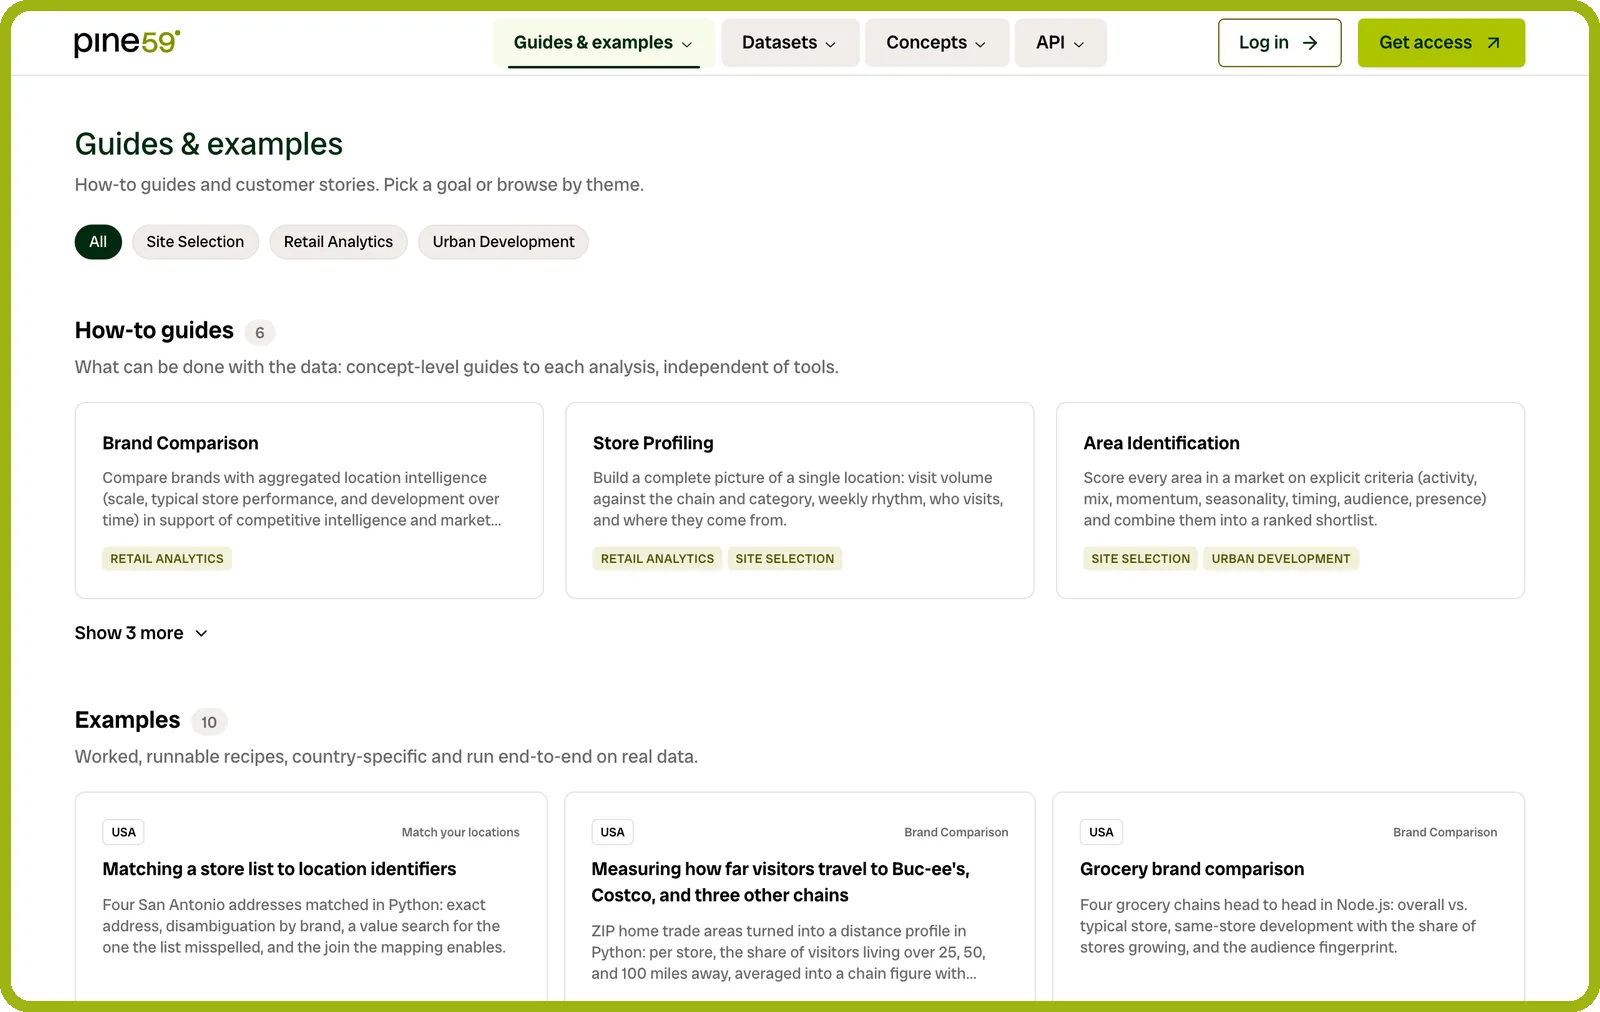
To the Pine59 Docs. How a visit is counted, what each dataset measures and how privacy is protected are all public, with no login.
How a visit is counted, in the DocsWeekly foot traffic usually arrives on Thursdays, and monthly within the first 2 weeks of the month.
Yes, with credit to Pine59. Use the foot traffic and your charts of it in yearly reports, board and council updates, grant applications and public dashboards.
What the Terms allowYes. The data is aggregated at the source, then small groups are held back and figures rounded, so no number can be traced back to an individual.
Yes. Compare the months before, during and after the work: how many visits the place gets, who its visitors are and where they come from. Compare the area around it too, so you can tell what the work changed from what changed everywhere.
A rebuilt street, worked through in the DocsYes. Add the park, downtown or square as a custom location, drawn to your own boundaries. It comes with years of history, so it compares with the years before from day one, and it reads like any other place, side by side with your others.
Yes. Pine59 shows who visits your downtown, where they live and which brands they already visit elsewhere, so you can see which businesses are missing and which would fit.
Finding what an area is missing, in the Docs