








Find where to open, and what fits
Where should we open next, and where not?
A guide for every question
 Find what's missingWhat a market lacks, against similar areas, competitors' networks or your own locations.Void Analysis, a worked example in the Docs
 Find places like your bestAreas that look like the ones around your best locations.Analog Modeling, a worked example in the Docs
 Rank areasEvery area in a market, scored on what matters to you and ranked into a shortlist.Area Identification, a worked example in the Docs
Worked examples on real locations
Start with the Docs, then choose how to work with the data.
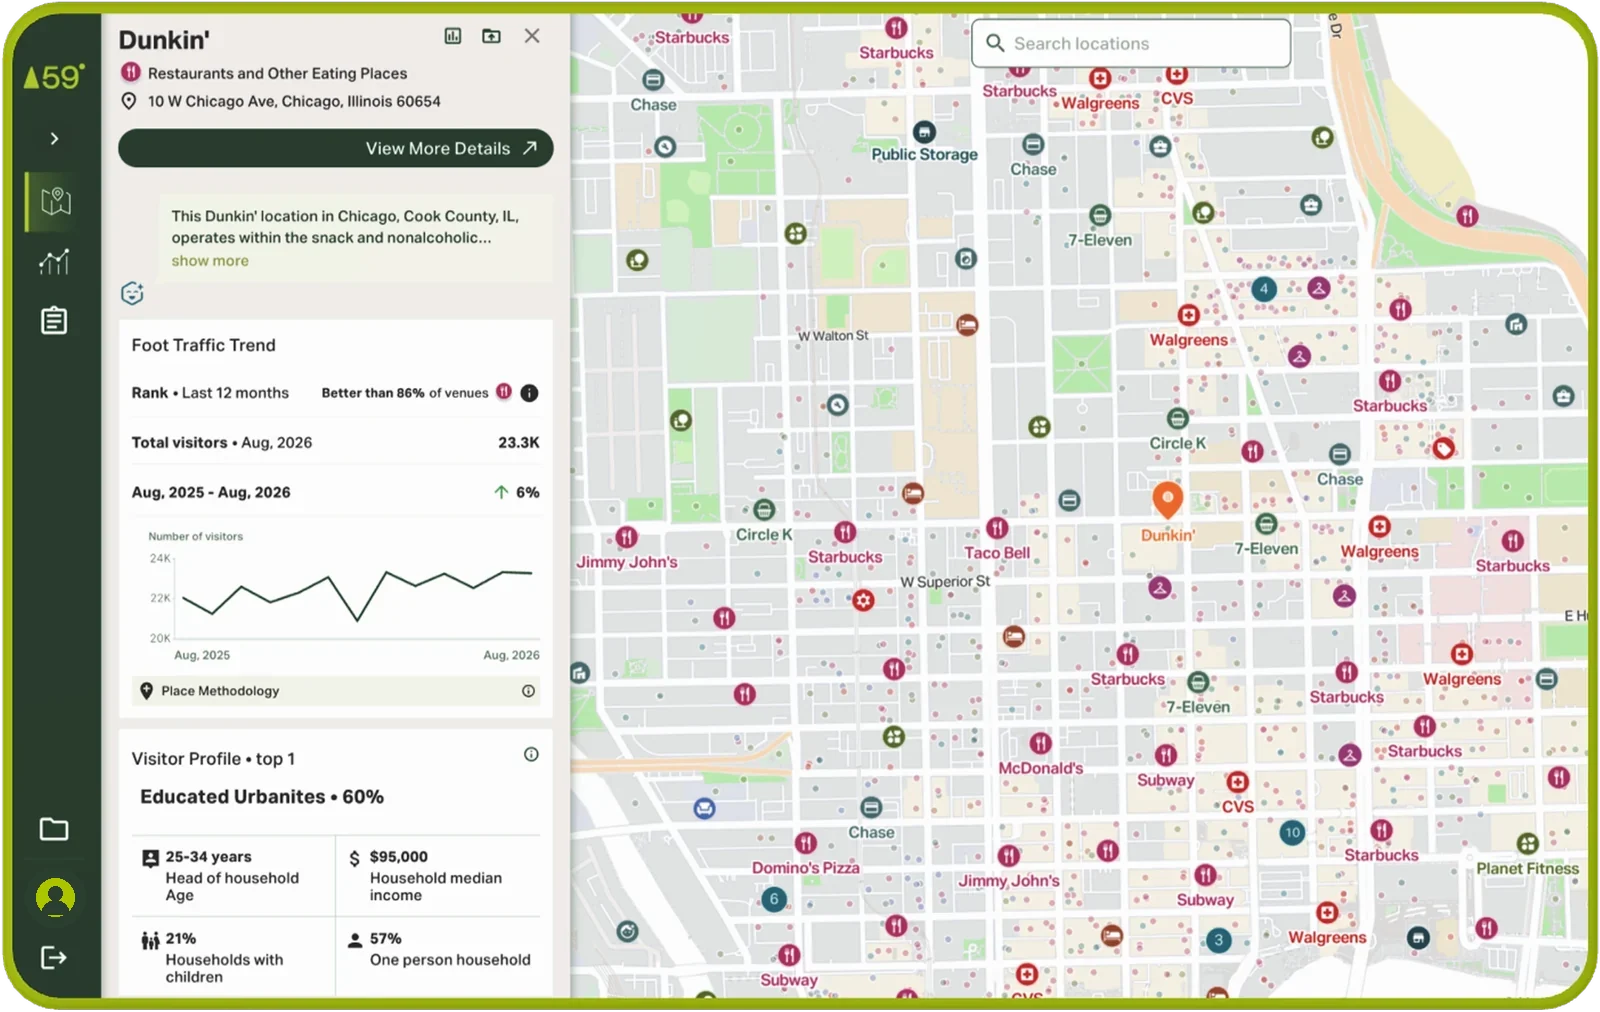
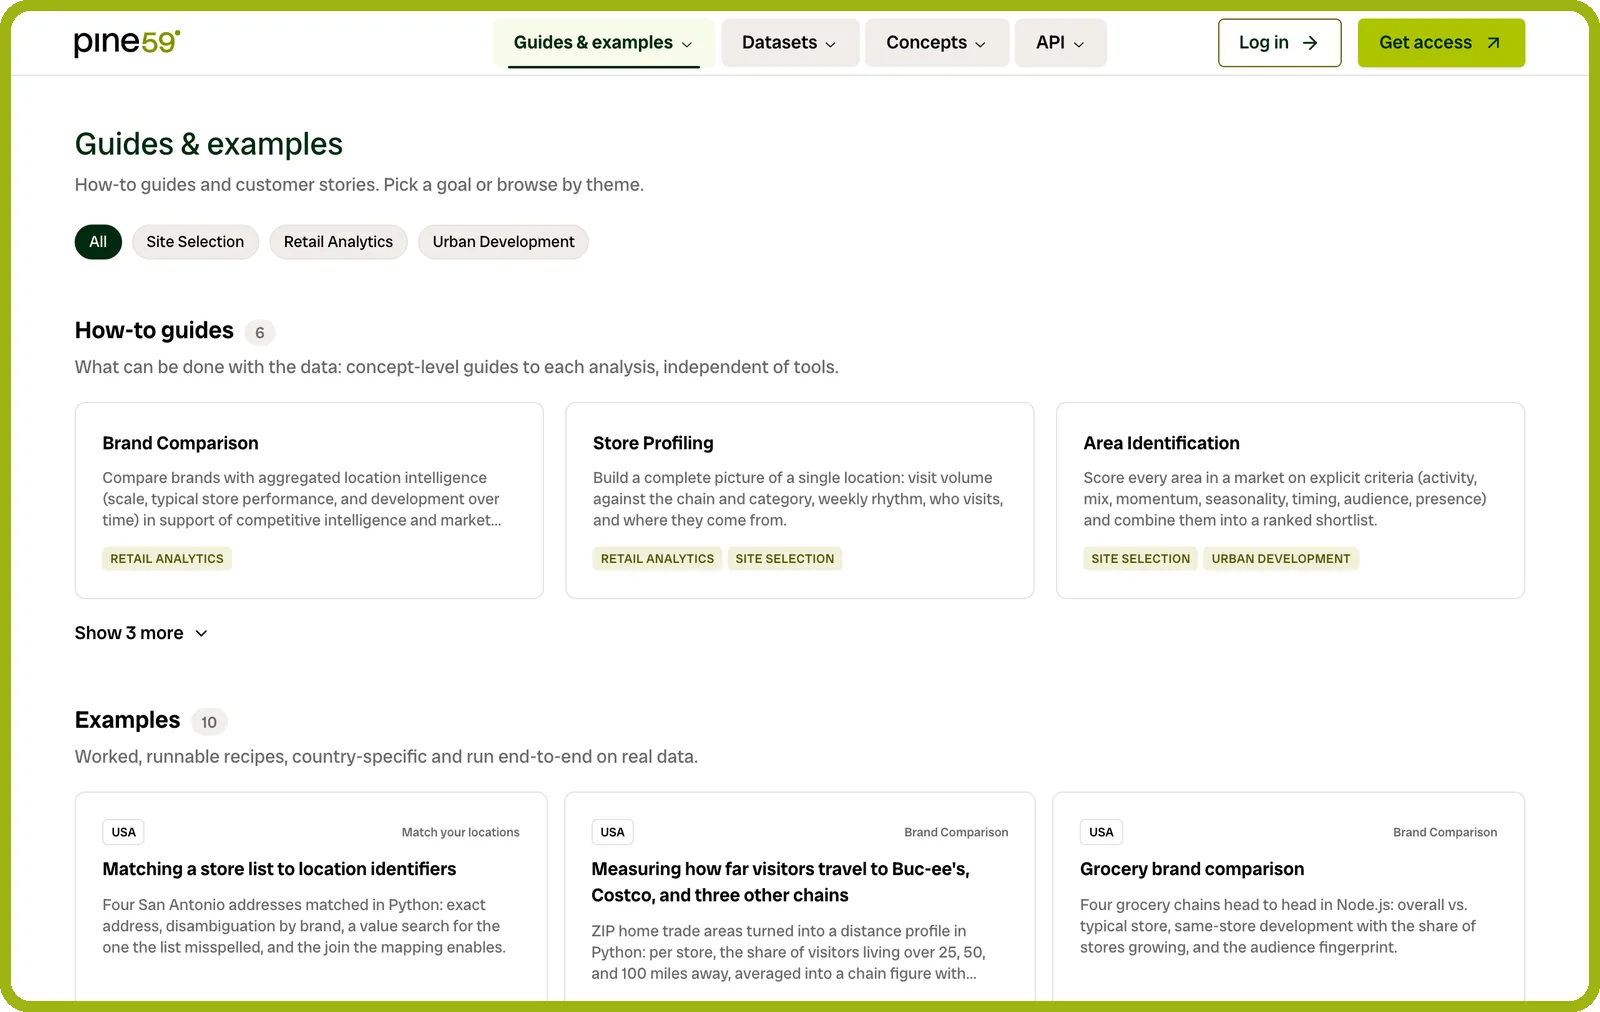
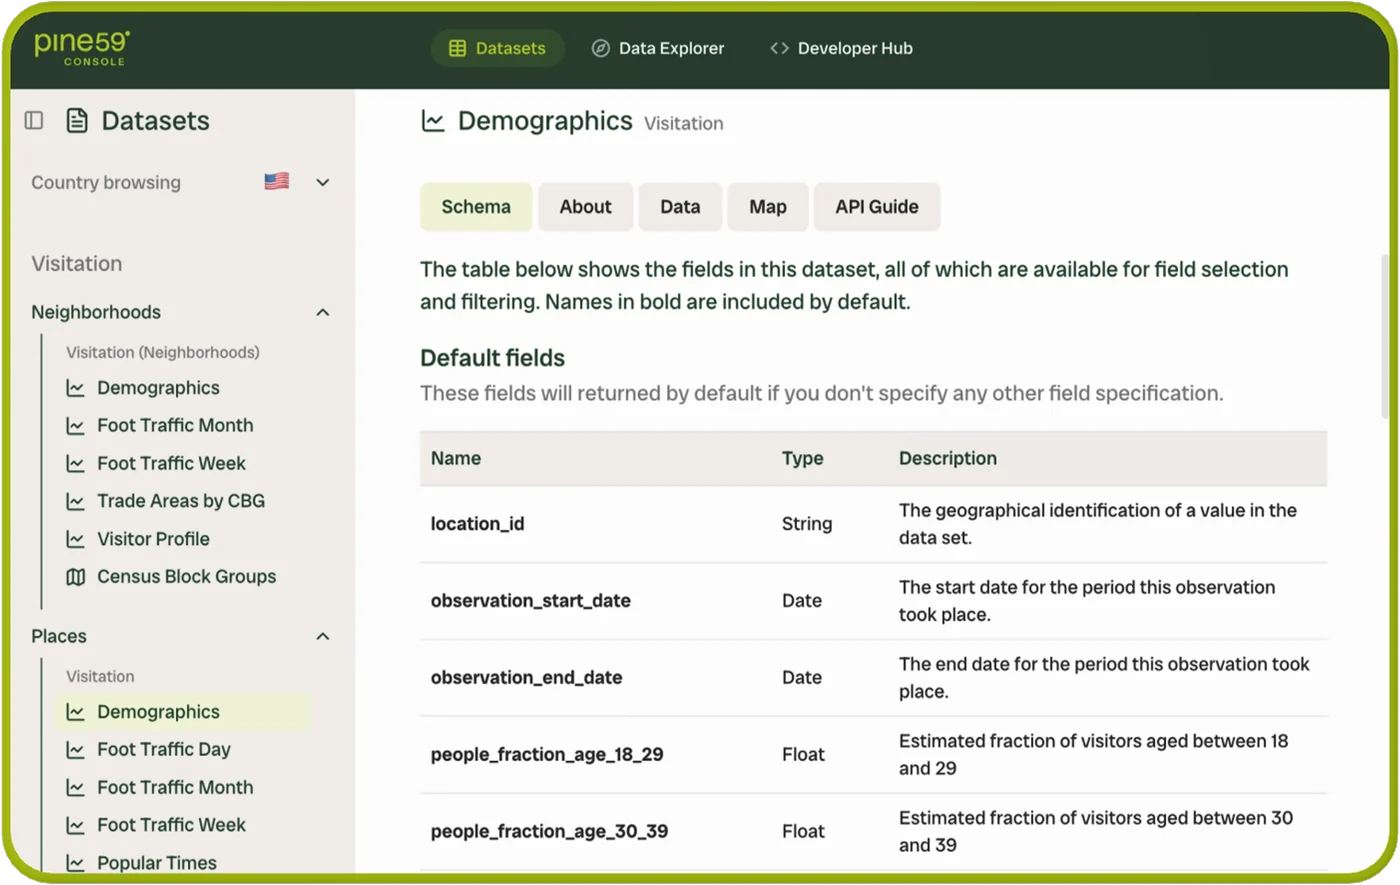
See how every number is made
Foot Traffic clearly defined
What one visit means in our numbers.
Read the visit definitionPrivacy built in
Aggregated at the source, never about individual people.
See how privacy worksTerms published in full
What a customer can do with the data, including sharing it with credit to Pine59.
Read the termsBefore getting started
Trusting the numbers
Foot traffic adds who is around a location and what similar locations have that it lacks: visits to the places and the area around it, who those visitors are, where they live and work, and each gap sized by visits. It sits next to what you already know about the location, such as its sales, its costs or its lease.

No. Residents, workers and visitors are aggregated for each area, never shown as people or addresses. Small groups are held back, and customers never receive device identifiers or movement histories.
How privacy is built in, in the Docs

In the US, to January 2019. Monthly foot traffic for places and block groups arrives within the first two weeks of the next month, and trade areas, demographics and visitor profiles every quarter. In Norway, Sweden, Finland and Estonia, to 2023, updated every month.
Using the data
Foot traffic compares the area with similar ones and shows what they have that it lacks, each gap sized by their visits. In the US, gaps show by category and chain; in the Nordics, by category.
Finding what an area is missing, in the DocsYes. Read the places beside it and the area it sits in: in the US its block group, in the Nordics and Estonia down to a 250 m square. To follow the plot or a new development as one location, add it as a custom location, in Insights or through the API as an enterprise service.
Yes. Similar locations are matched on foot traffic, who visits and what operates there; your own sales come in only for look-alikes of your best locations.
Finding look-alike locations, in the DocsOverlap the candidate's catchment with your locations' catchments. Visits the candidate would take from your own locations move rather than grow; the share that matches visits already leaving the area is new to your network.
Void AnalysisIn the US, yes. Addresses of open locations match Pine59's places directory by address, brand or name, and foot traffic, trade areas and visitor profiles join on the same location ID. An empty unit or a plot has no visits of its own: read the area around it, or add it as a custom location. A single store inside a mall reads best as part of its mall.
Matching a list of locations, in the DocsPlaces and markets
No. Pine59 has no sales or transaction data, draws no drive-time trade areas and doesn't know rents or units. It gives the visits, the audience and the catchment around a site, the inputs a sales forecast uses, to set next to your own sales and costs.
Chains and their rankings are for the US. In Norway, Sweden and Finland, areas come down to a 250 m square, split into residents, workers and visitors, and places come daily and monthly, back to 2023; chains come through the API. Estonia has areas too.
Every dataset by market, in the Docs

Bring your places.See how they perform.
- 01Your use case
- 02A short meeting
- 03Trial the data
- 04Sign and go live