








Deliver data on any location
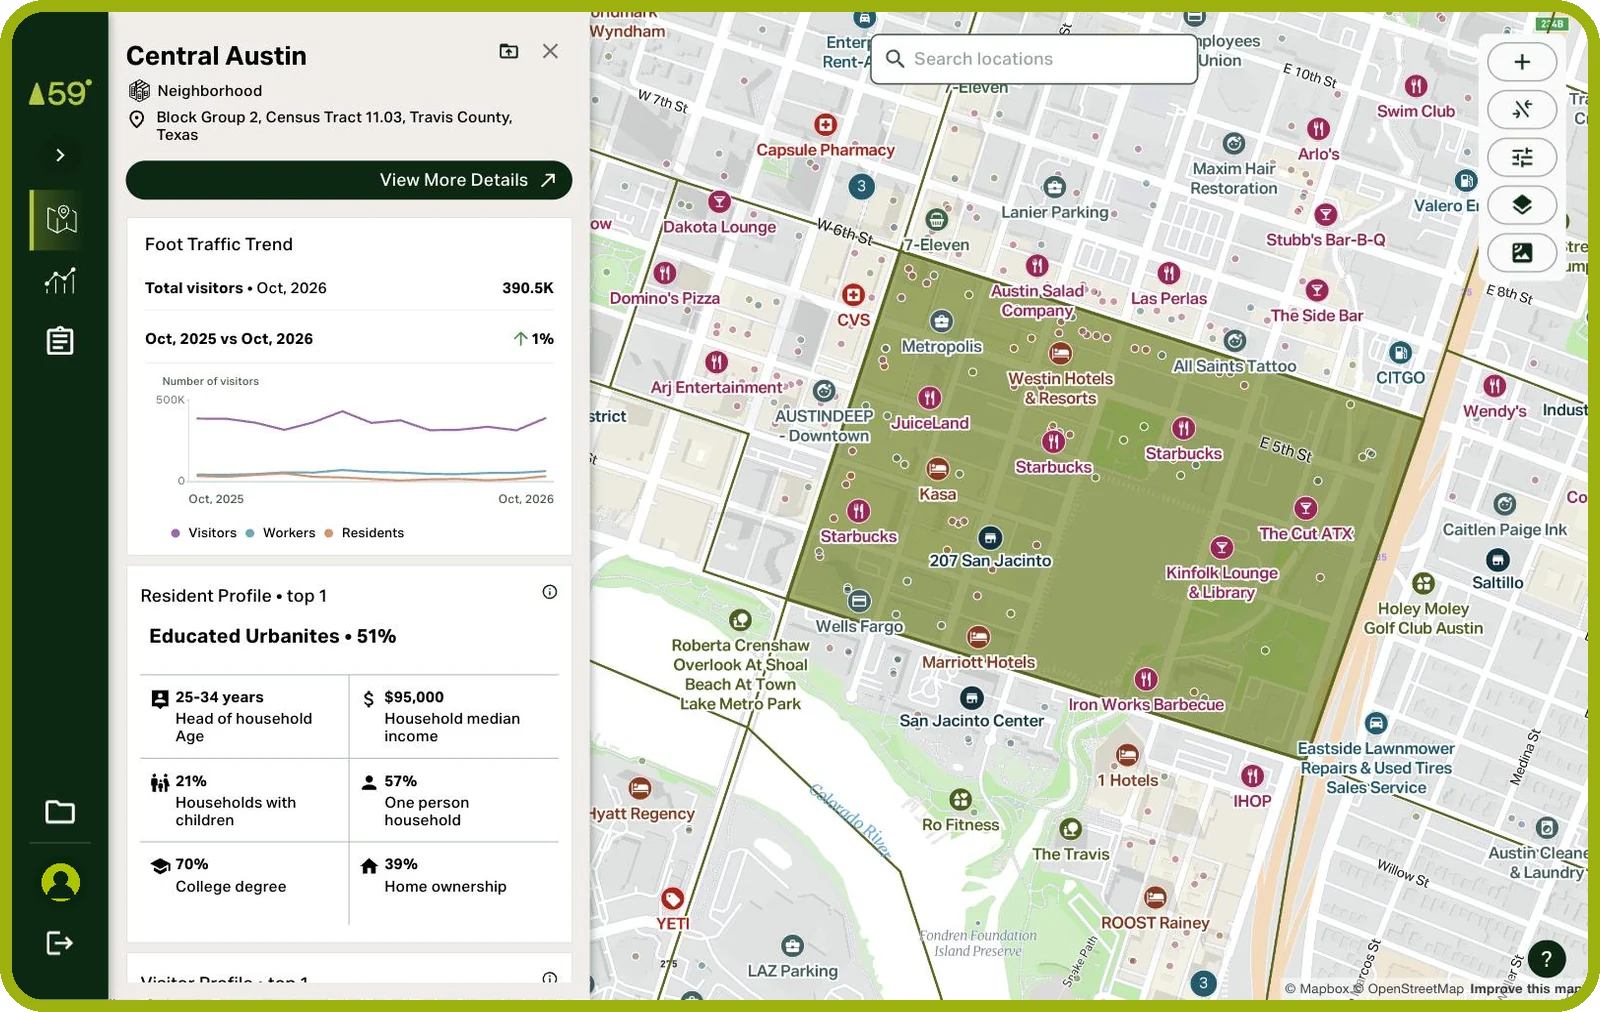
Add any corridor, downtown or site as a custom location, and get its data.
Unacast’s Aggregated Location Insights business is now Pine59
Read more hereVisits against last year
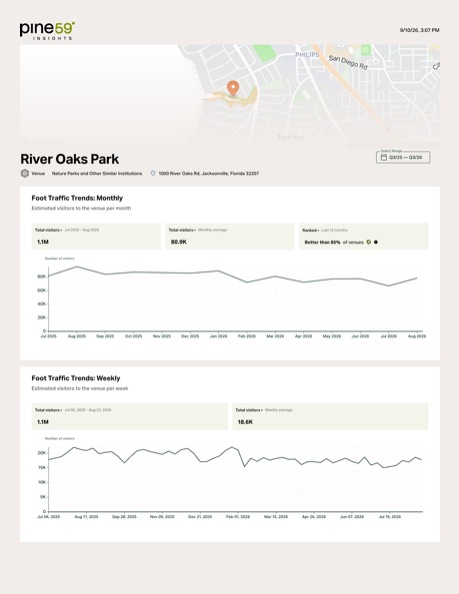
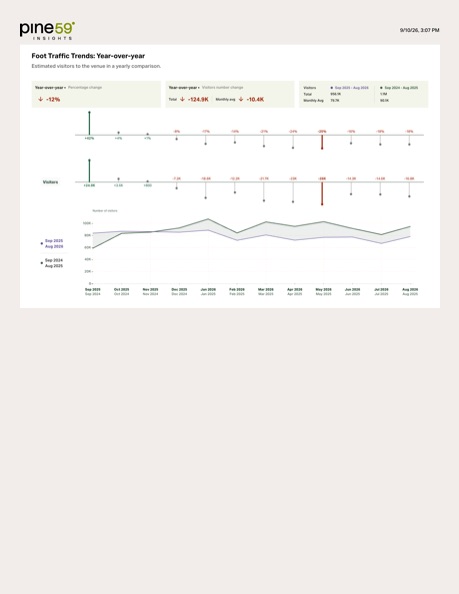
Add any corridor, downtown or site as a custom location, and get its data.
Put the numbers in client decks, credited to Pine59. Delivered reports stay in use after the contract ends.
Read the termsPast numbers don't change without notice, so this year's study compares with last year's.
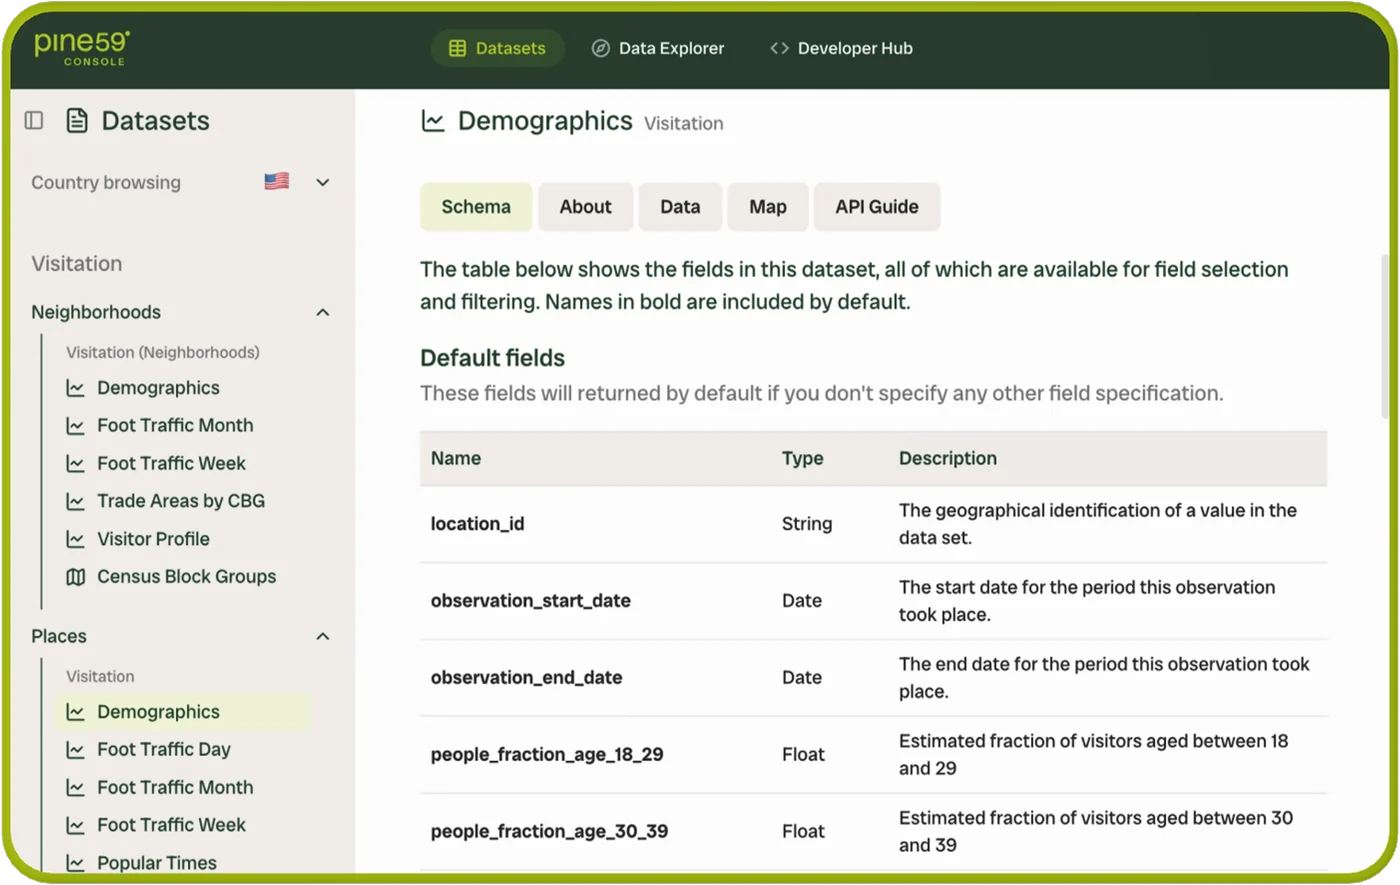
Every field in each US dataset and how often it updates.
Browse the US datasetsEvery request and the response it returns.
Open the API referenceWhat one visit means in our numbers.
Read the visit definitionAggregated at the source, never about individual people.
See how privacy worksThey add to them: how many visits each place gets, who its visitors are and where they come from, and how each place compares with the places around it and with last year.
Two things. US foot traffic and visitor journeys carry a confidence score, and the method behind every number is public in the Docs, so the client's analysts can follow it.
How a visit is counted, in the DocsYes. If a model improvement restates past numbers, the whole history moves together, so last year's places re-run on the same basis. You're told what changed, by how much and what to do.
Weekly foot traffic usually arrives on Thursdays, and monthly within the first 2 weeks of the month. US history goes back to January 2019.
Foot traffic numbers, charts and analyses in the work your client pays for, credited to Pine59, and you can name Pine59 as the data provider. The datasets themselves aren't passed on as they are.
What the Terms allowYes, on terms set in the contract. A tool clients log in to is licensed separately from report work, so it's settled before the first client sees it.
Yes. Ongoing reporting usually runs as a subscription, and a single study can be scoped on its own. Pine59 suggests the best fit on the first call.
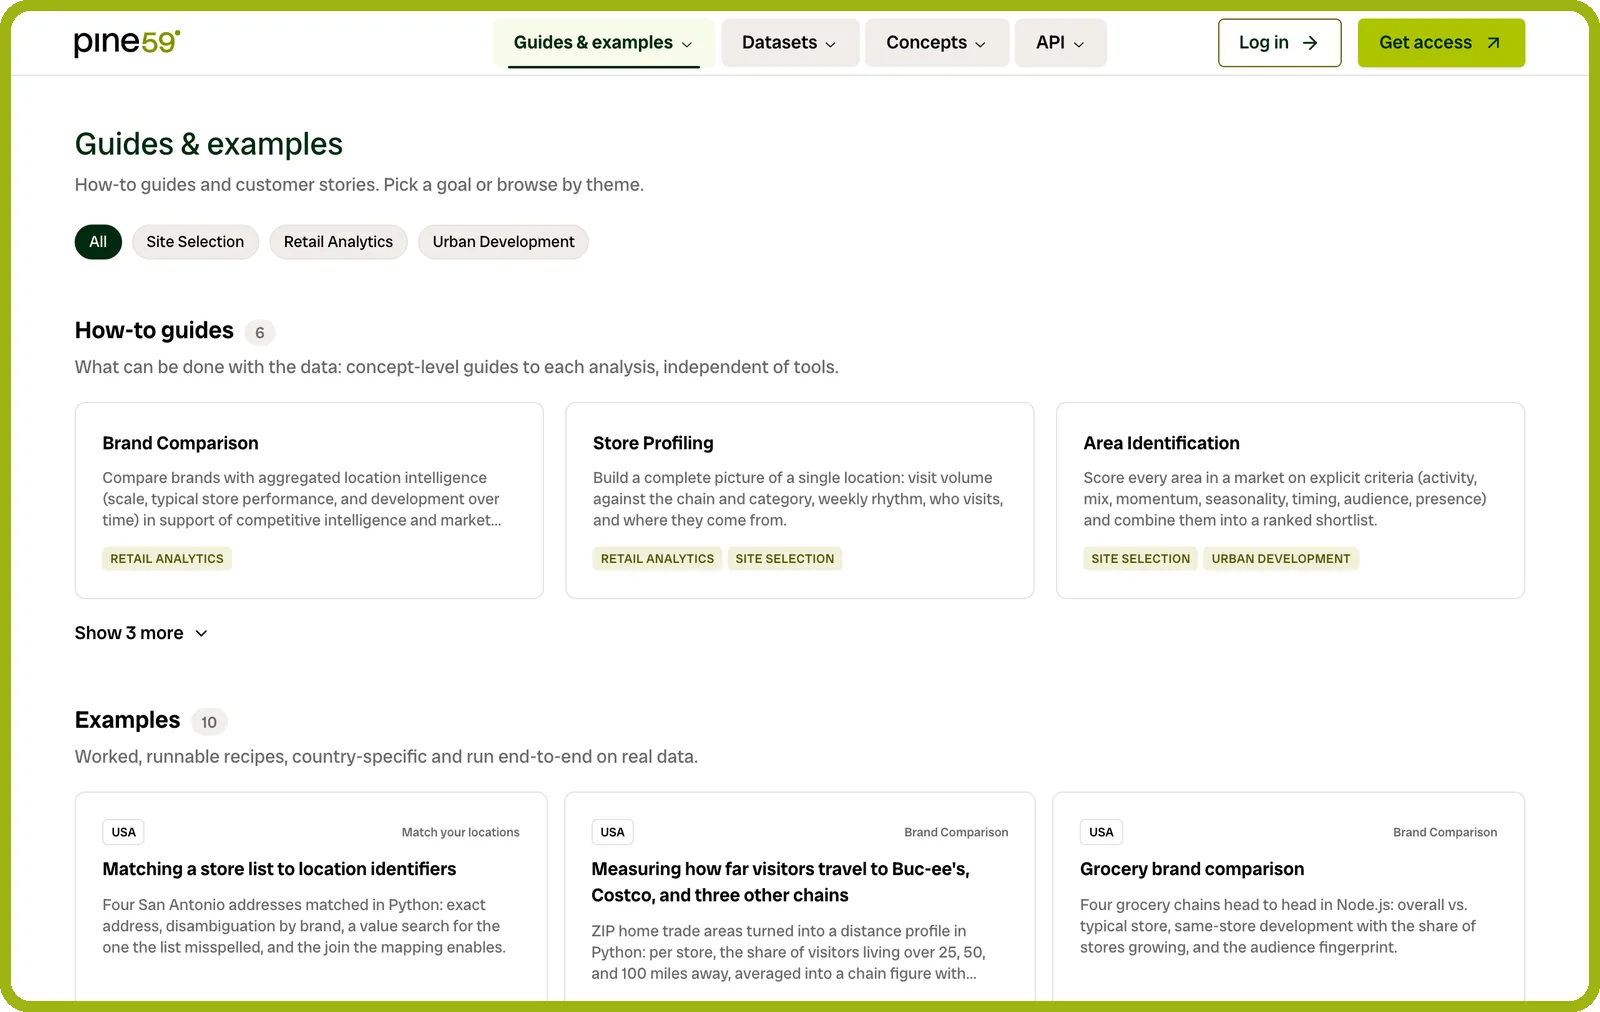
Yes. Match the store list to Pine59's places by address, add areas as custom locations, and pull whole markets at once.
Matching a store list, in the DocsYes, in Norway, Sweden and Finland: areas down to a 250 m square by the hour, split into residents, workers and visitors, places daily and monthly back to 2023, and trips between areas and road traffic by the hour. Estonia has areas too.
Every dataset by market, in the Docs